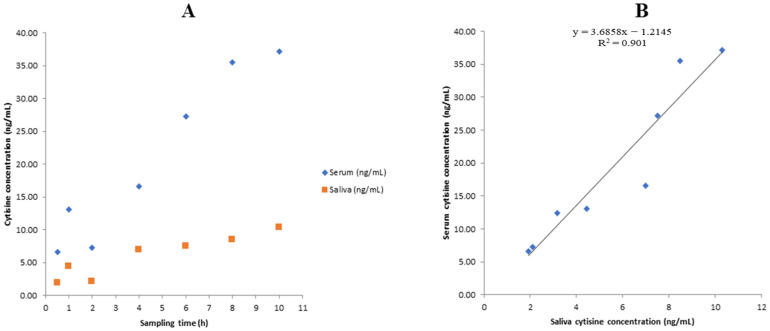
Figure 5.
(A) The concentrations of CYT in serum and saliva (samples collected on the first day of the treatment). (B) The correlation between serum and saliva CYT concentration. The CYT concentrations were measured in samples obtained from an ENDS user treated with CYT at the standard dosing regimen.

