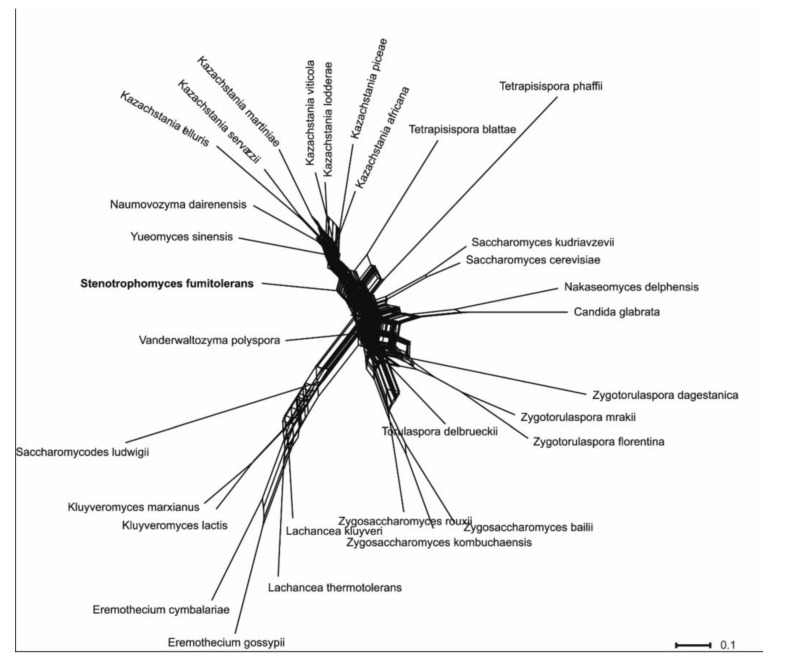
Figure 2.
Consensus network obtained from the combined analyses of single-gene maximum likelihood trees of SSU, 5.8S rRNA, LSU, TEF1 and RPB2 alignments. The scale indicates mean distance obtained from the analysis of single-gene trees. Accession numbers of nucleotide sequences are provided in Supplementary Table S1.

