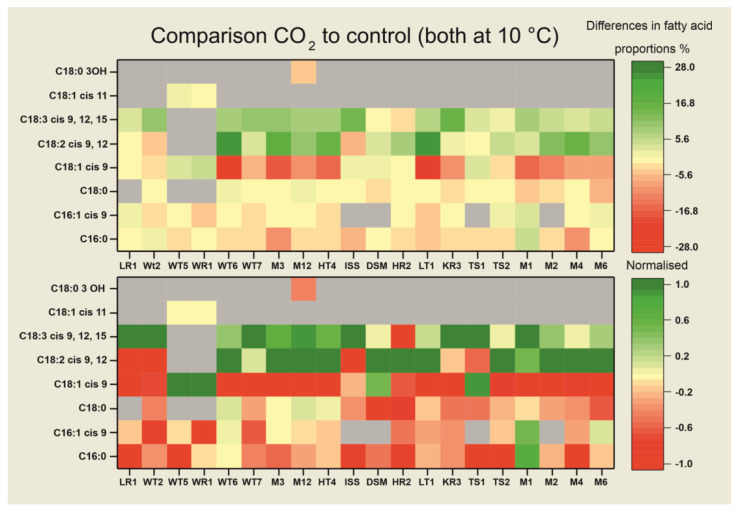
Figure 3.
Comparison of averaged changes in total fatty acid compositions of MAP-treated samples at 10 °C to the controls at 10 °C. Increases in fatty acid contents of MAP-treated samples compared to the controls are highlighted in green, while decreases are highlighted in red with the intensity of the color correlating to the extent of the difference. In the lower graph, differences in the fatty acid contents are normalized in order to individually display changes for each sample. When a fatty acid is not detected in a sample or the content is below <1%, it is not included, and is therefore displayed in grey. The organisms are mentioned by their strain designations. “DSM” resembles the strain DSM 1075, and “ISS” resembles the strain IF2SW-F4.

