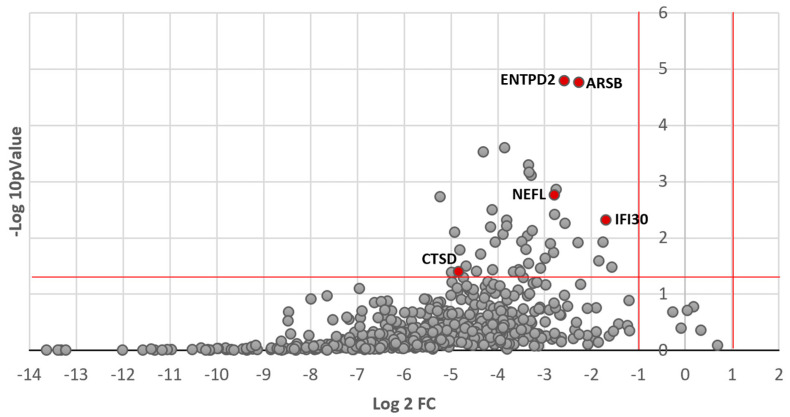
Figure 1.
Volcano plot of exploratory proteomic analysis showing CSF concentration changes between T0 and T6 for the whole cohort. Log2 of the fold change is represented on the x-axis and -log10 of the p value on the y-axis. The horizontal red line indicates p = 0.05 and the vertical red lines indicate a fold change greater than 1 or inferior to −1. Most samples with statistically significant p-values are clustered between −1 and −5 on the x-axis, which indicates a significant decrease (at least 0.5-fold change) in the concentration of these proteins. Top predictive proteins and CTSD are identified on the graph for reference, and all 43 significantly altered peptides are listed in the supplementary table.

