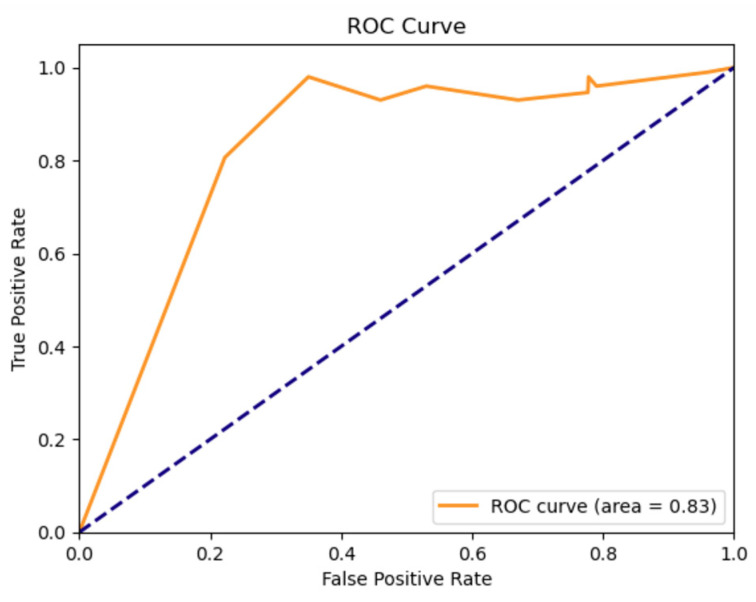
Figure 3.
ROC curve of the machine learning predictive model of motor improvement at 2 years, depicting true positive rate (sensitivity) on the y axis and false positive rate (1-specificity) on the x-axis. The Random Forest model ROC AUC was 0.83, showing a strong discriminative ability. The blue dotted line represents a non-discriminatory (random) model.

