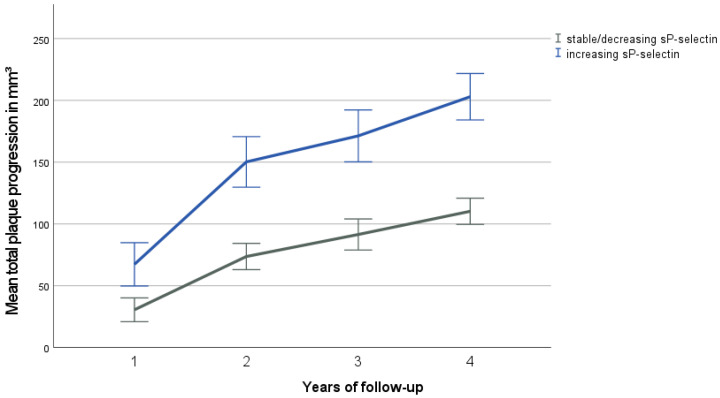
Figure 3.
Mean total plaque progression by follow-up visit and sP-selectin-group (increasing vs. stable or decreasing sP-selectin levels). Follow-up visits occurred annually. Error bars represent a range of ±1 standard error of the mean (SEM). The group with increasing levels shows significantly higher plaque progression over the course of time (p < 0.05).

