Figure 1.
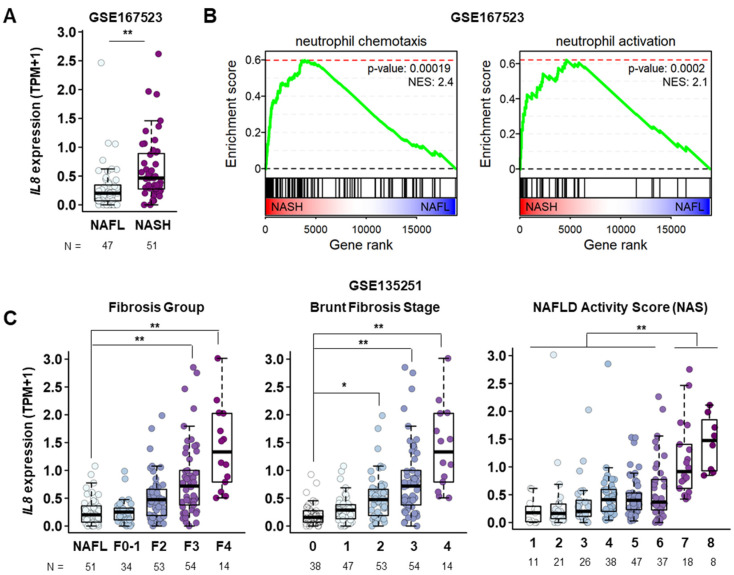
Elevated IL8 transcript levels in the course of NAFLD progression. (A) mRNA expression levels of the IL8 gene in the livers of patients with fatty liver (n = 47) and NASH (n = 51) from a publicly available RNA sequencing database (GSE167523). Statistical significance was assessed using Student’s t-tests (** p < 0.01). (B) GSEA plots showing the enrichment of genes associated with neutrophil chemotaxis and neutrophil activation in gene rank based on differential expression between NASH vs. NAFL livers. (C) mRNA expression levels of the IL8 gene in the liver among different stages of NAFLD obtained from a publicly available RNA sequencing database (GSE135251). F0–F1, F2, F3, and F4 represent different NASH groups classified by the severity of fibrosis. TPM refers to transcripts per million base pairs. For comparisons involving more than three groups, a one-way analysis of variance (ANOVA) was conducted, followed by post-hoc Tukey’s tests to determine specific group differences. (* p < 0.05, ** p < 0.01). IL8, interleukin 8; GSEA, gene set enrichment analysis; NAS, NAFLD activity score; NAFLD, nonalcoholic fatty liver disease; NASH, nonalcoholic steatohepatitis.

