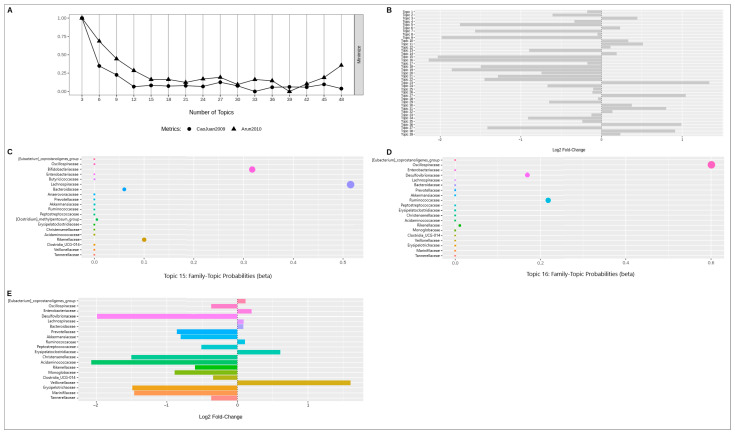
Figure 7.
The results of latent Dirichlet allocation analysis for SILVA data; (A)—Indicator chart for selecting the number of topics; (B)—Bacterial topic contribution to sample distinction; (C)—Summary of the 21 topics; (D)—Summary of the 25 topics; (E)—Bacteria contribution to sample distinction. Different colors on the subfigures (C–E) indicate different bacterial taxa. The dot size on the subfigures (C,D) reflects the probability value.

