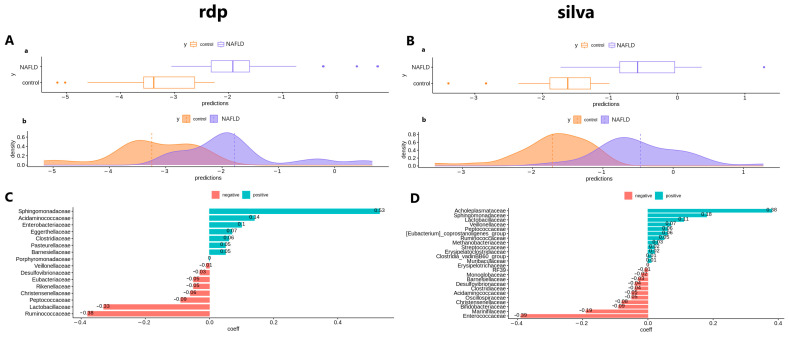
Figure 8.
The results of penalty regression for NGS data; (A)—Sample distribution of RDP data ((a)—box plot and (b)—density plot of the data); (B)—Sample distribution of SILVA data ((a)—box plot and (b)—density plot of the data); (C)—Contribution coefficients of bacteria to sample difference (RDP data); (D)—Contribution coefficients of bacteria to sample difference (SILVA data).

