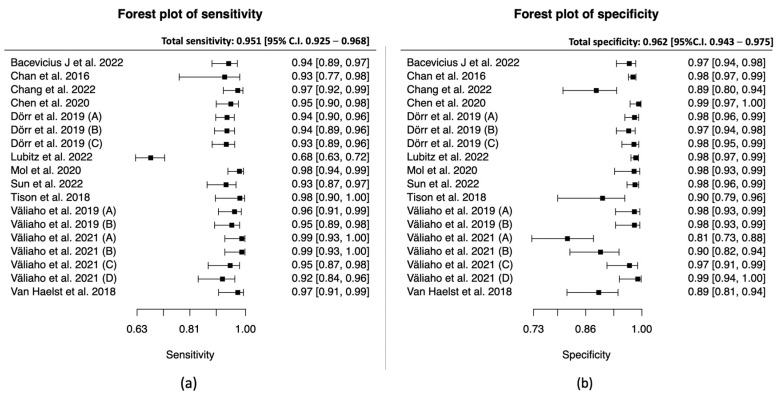
Figure 3.
PPG group: (a) Forest plot of sensitivity; (b) forest plot of specificity. (Väliaho et al., 2019; (A): testing the AFEvidence algorithm, Väliaho et al., 2019; (B): testing the COSEn algorithm, Väliaho et al., 2021; (A): testing device performance when time interval between every measurement is 10 min, Väliaho et al., 2021; (B): testing device performance when time interval between every measurement is 20 min, Väliaho et al., 2021; (C): testing device performance when time interval between every measurement is 30 min, Väliaho et al., 2021; (D): testing device performance when time interval between every measurement is 60 min, Dörr et al., 2019; (A): testing performance of device when recording for 1 min, Dörr et al., 2019; (B): testing performance of device when recording for 3 min, Dörr et al., 2019; (C): testing performance of device when recording for 5 min).

