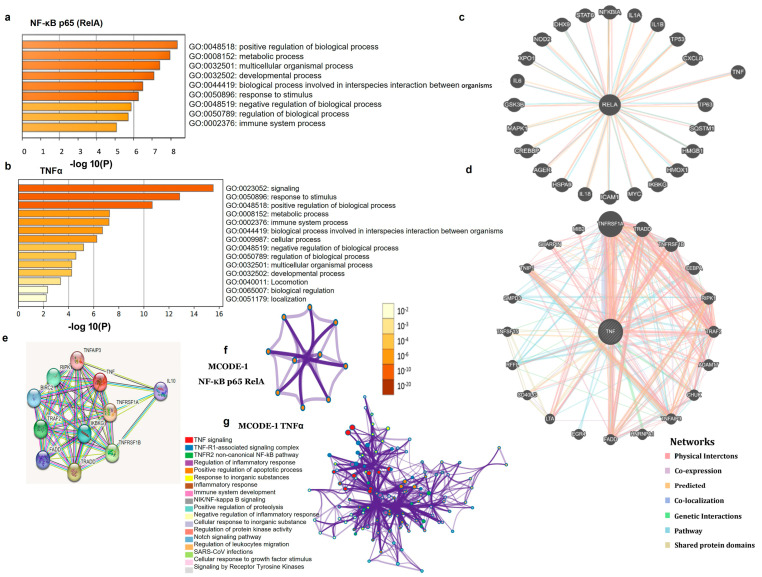
Figure 3.
Proteinprotein interaction and functional enrichment analysis. (a) Clustered enrichment ontology categories (GO and KEGG terms) across the input gene NF-κB p65 (RelA), colored by p-values by Metascape. (b) Metascape also constructed biological processes from the histogram of TNFα. (c–e) Gene interaction of NF-κB p65/RelA and TNFα by GeneMANIA and STRING. (f) The main biological processes in MCODE1 of NF-B p65 (RelA) involving the interacting genes are depicted using a cluster analysis from Metascape. In Metascape, MCODE complexes can be recognized automatically based on their IDs. Network representation of enriched biological pathways facilitates the connections between various biological processes. (g) Network of the enriched term of TNFα that was entered into this system for analysis. A circle node represents each term, and the node size is directly proportional to the number of input proteins grouped into each term. The node’s color denotes its cluster identity. GO terms with a similarity score >0.3 are connected by an edge, and the edge thickness represents the similarity score.

