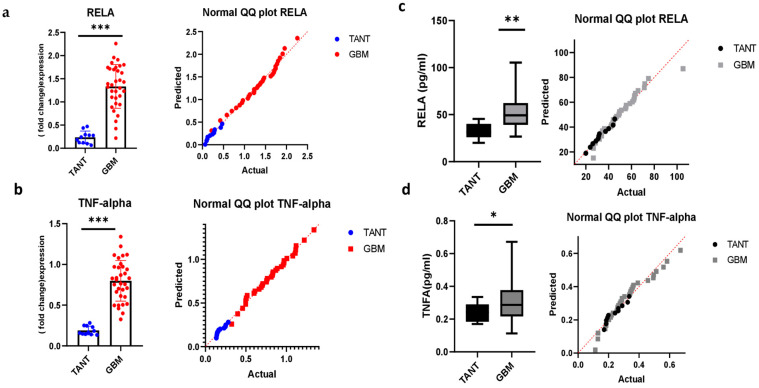
Figure 5.
Quantification, expression, and verification of NF-κB p65 (RelA) and TNFα in glioblastoma patients. (a,b) Elevated expression levels of the two candidate genes in biopsy tissue of glioblastoma. Distributions of gene expression levels are displayed, with the statistical significance of differential expression evaluated using the t-test. *** p < 0.001. The values of three biological replicates are shown, indicating a univariate normality test. The graphs were plotted with the GraphPad Prism 9 (Prism 9.5.0) software. (c,d) An enzyme-linked immunosorbent assay validated the expression of DEGs in glioblastoma patients with univariate normalization using the t-test. ** p < 0.01 and * p < 0.05, respectively.

