Figure 6.
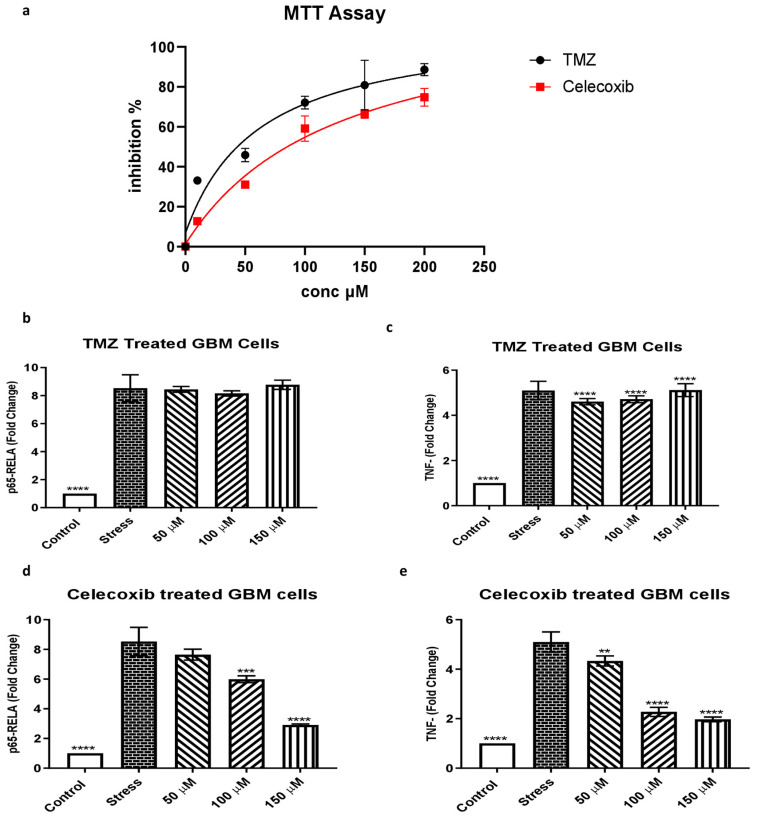
Assessment of cytotoxicity by MTT proliferation assay. The inhibition ratio of GBM cells after treatment with TMZ and celecoxib at different concentrations for 48 h. (a) Black and red curve TMZ and celecoxib in a dose-dependent manner. Increasing the concentration of any of these drugs makes the cytotoxic response more potent. The quantitative analysis of MTT is represented as the mean ± SD of three independent experiments. when compared to the untreated control. (b) Quantitative RT-PCR analysis of mRNA expression levels of the inflammatory marker NF-κB p65 (RelA) in the glioblastoma SF-767 cell line treated with TMZ at 50 µM, 100 µM, and 150 µM. The GAPDH gene was used as the internal control to normalize the data. IL-1B was used as stress to trigger an inflammatory cascade. The mRNA expression of genes was computed as a fold change compared to the control. The data are presented as the mean ± SD of the triplicate tests compared with the control group (p ≤ 0.05 for each). **** p < 0.0001. (c) Similarly, mRNA expression levels of the inflammatory marker TNFα in the glioblastoma SF-767 cell line treated with TMZ at 50 µM, 100 µM, and 150 µM. **** p < 0.0001. (d) Quantitative RT-PCR analysis of mRNA expression levels of NF-κB p65 (RelA) in the glioblastoma SF-767 cell line treated with celecoxib at 50 µM, 100 µM, and 150 µM. The GAPDH gene was used as the internal control to normalize the data. *** p < 0.001 and **** p < 0.0001. (e) Similarly, mRNA expression levels of TNFα in the glioblastoma SF-767 cell line treated with celecoxib at 50 µM, 100 µM, and 150 µM. ** p < 0.01 and **** p < 0.0001.

