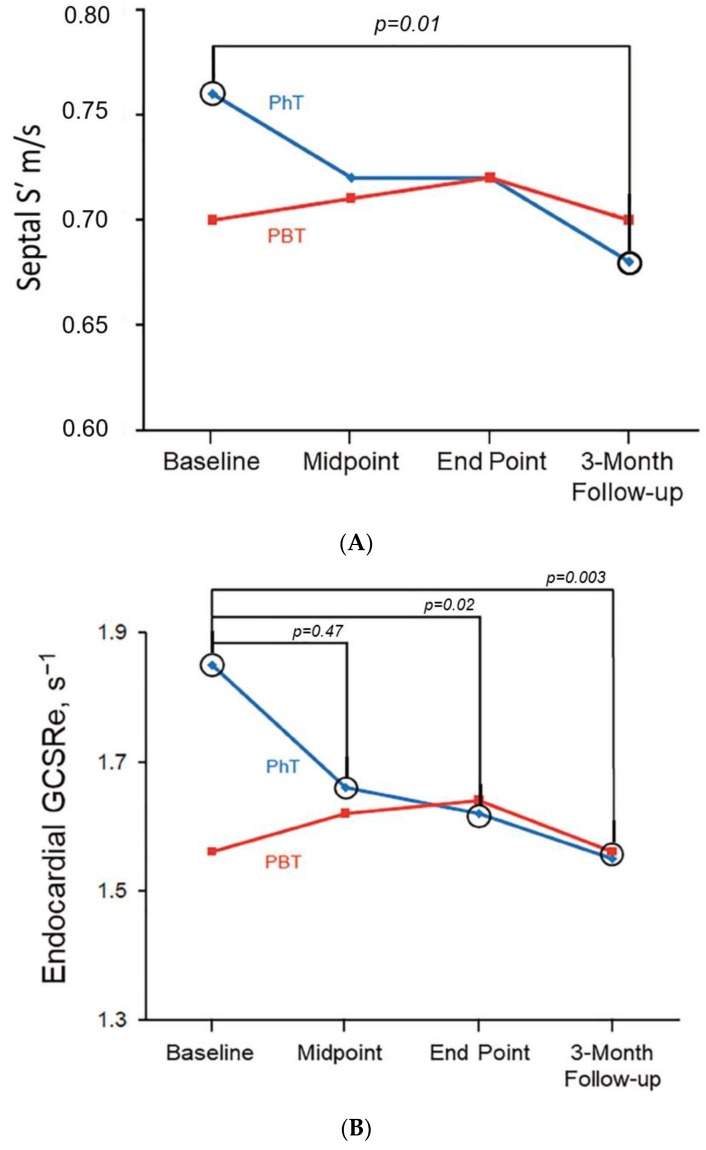
Figure 3.
Changes in indicators of cardiac function during treatment. (A) Changes in systolic tissue Doppler velocity for patients treated with PhT vs. PBT. (B) Changes in GCSRe for patients treated with PhT vs. PBT. GCSRe indicates global circumferential early diastolic strain rate; PBT, proton beam therapy; PhT, photon beam therapy; S′, systolic mitral annular tissue velocity.

