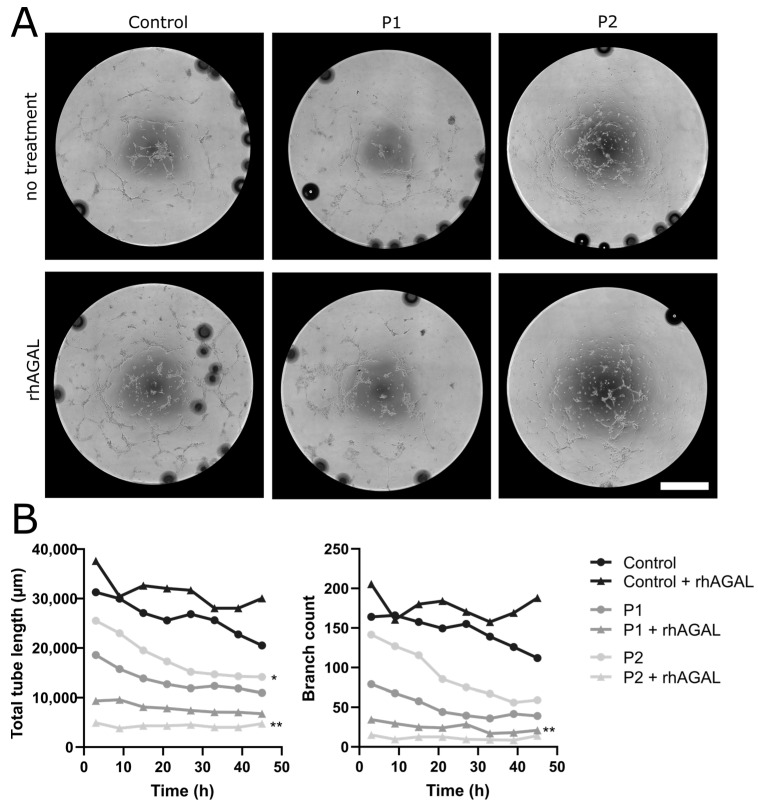
Figure 4.
Changes in tube formation properties in control and patient EC. (A) Reduction in tubular structures in the EC of P1 and P2 compared to the healthy control independent of treatment with agalsidase-α. (B) Timepoint analysis showed reduction in total tube length in P2 and branch count in P1 compared to the control EC (n = 3 per clone, 2 clones per cell line, conducted with and without treatment). Abbreviations: rhAGAL: recombinant human agalsidase-α, P1,2: Fabry patients. Scale bar: 1 mm. Statistics: Friedman test. * = p < 0.05, ** = p < 0.01.

