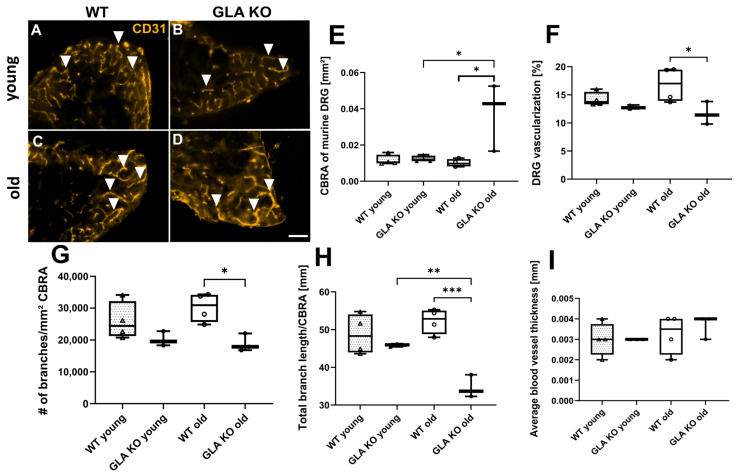
Figure 14.
Vascularization of murine DRG neurons. (A–D) Representative photomicrographs of CD31+ blood vessels in DRG of young and old WT and GLA KO mice (full arrowheads). (E) Measurement of DRG CBRA, (F) DRG vascularization, (G) quantification of blood vessel branches per CBRA, (H) measurement of total branch length, and (I) measurement of average blood vessel thickness in DRG of young WT (△, n = 4 in all graphs), young GLA KO (▲, n = 4 in Figure 14E, n = 3 in all other graphs), old WT (○, n = 4 in all graphs), and old GLA KO (●, n = 3 in all graphs) mice. Statistical analysis: Kruskal–Wallis test with Dunn’s multiple comparison test in Figure 14E. One-way ANOVA with Tukey’s multiple comparison test in Figure 14F–I. Abbreviations: CBRA: cell-body-rich area, DRG: dorsal root ganglia, GLA KO: α-galactosidase A knock-out, WT: wild type. Scale bar: 100 µm. Statistics: Kruskal–Wallis test with Dunn’s multiple comparison test in Figure 14E. One-way ANOVA with Tukey’s multiple comparison test in Figure 14F–I. * p < 0.05, ** p < 0.01, *** p < 0.001.

