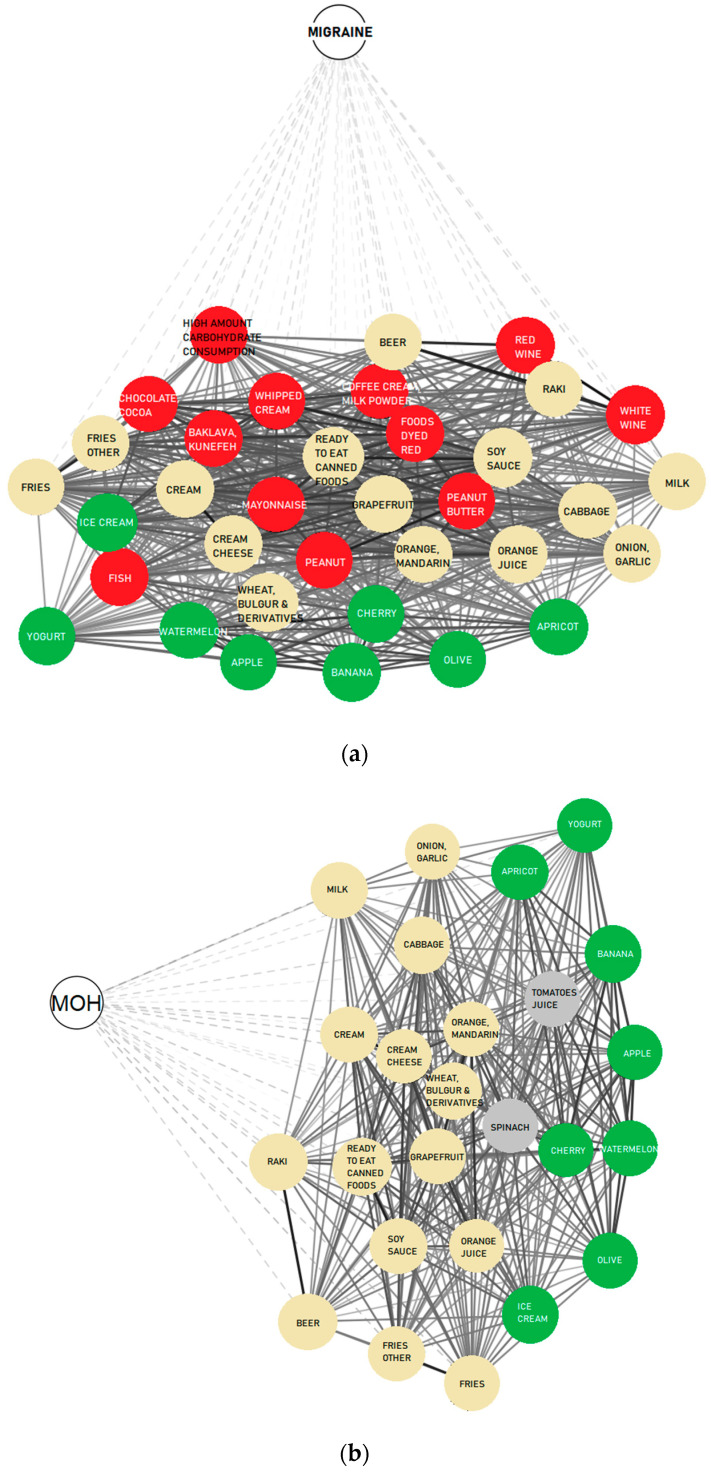
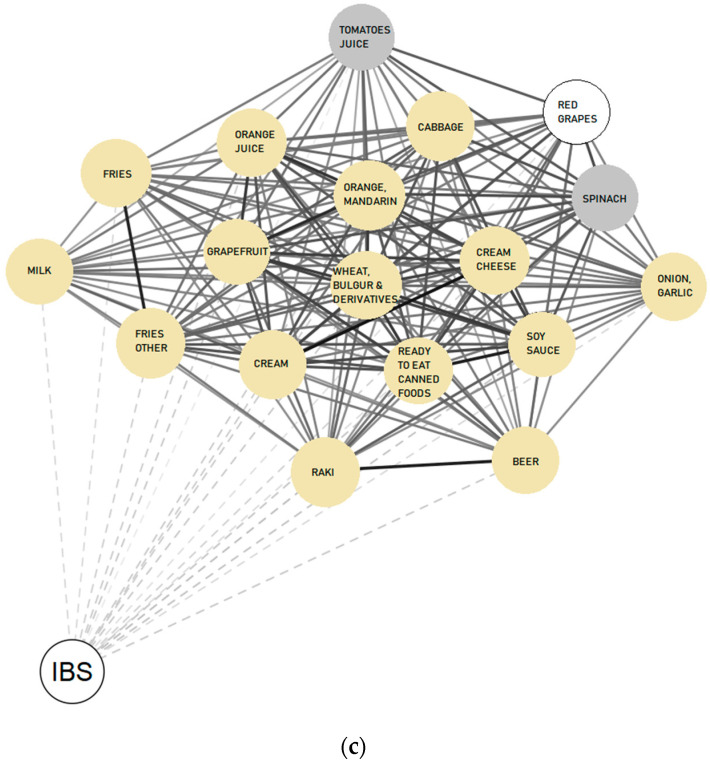
Figure 3.
Food triggers of the subjects. Network graphics were made according to the correlation levels among variables. Food triggers for (a) migraine, (b) MOH and (c) IBS are given in the figure. Groups represent structures with similar nodes clustered. Food triggers shared by subjects with MOH, migraine or IBS are in neutral colors, and specific foods for MOH (green), migraine (red) and IBS (yellow) are in bright colors. Line thickness denotes the strength of association between two nodes in the network graphic. Cluster distance signifies the similarity or difference between groups. Nodes with similar features are closer to each other than nodes with different properties. Network Graphic is illustrated by using JASP 0.14.1.0 program.


