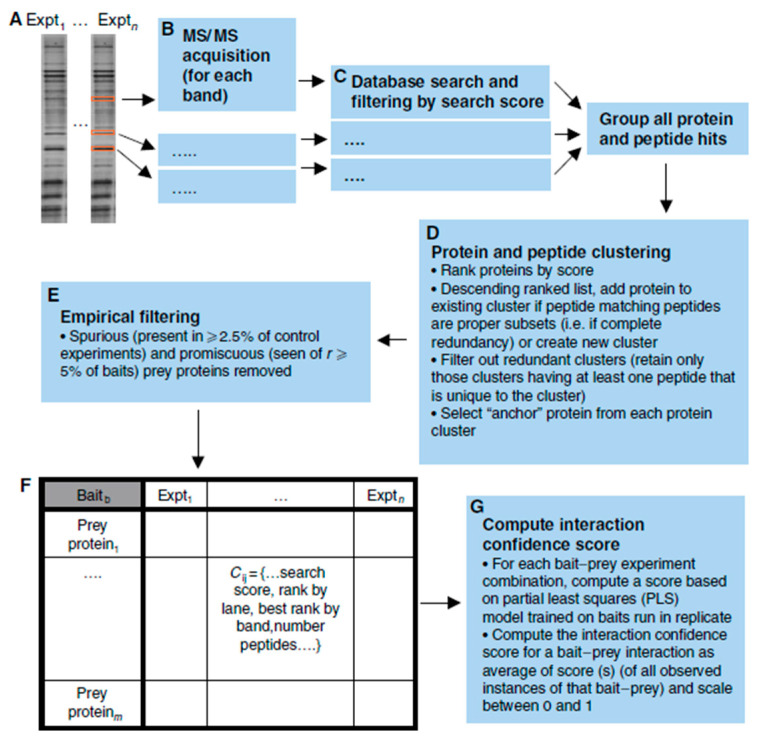
Figure 6.
Schematic of the IP-HTMS pipeline. Bait proteins were isolated with their prey partners through immunoprecipitation and identified after SDS-PAGE and mass spectrometry. The proteins and peptides are clustered based on a scoring system and filtered. Finally, a confidence score is calculated for each bait–prey interaction. Figure taken from [26].

