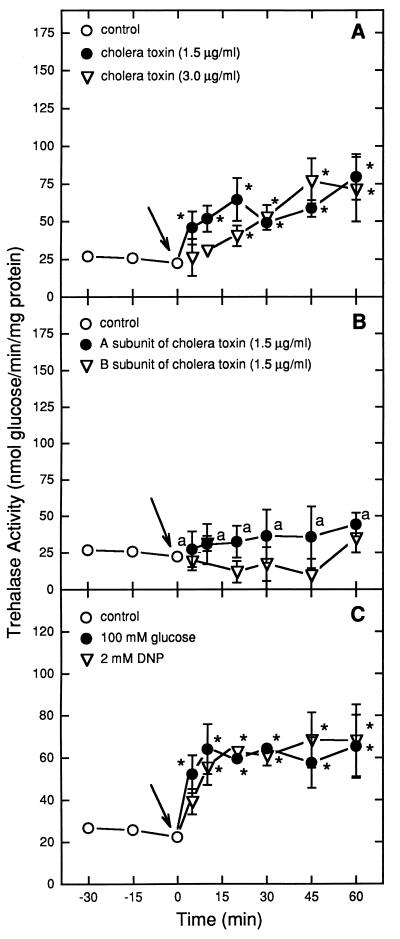
FIG. 2.
Effect of 1.5 and 3.0 μg of CT per ml (A), of the A or B subunit of CT (B), or of 100 mM glucose and 2 mM DNP (C) on trehalase activity in S. cerevisiae W303. Specific activity is expressed as nanomoles of glucose released per minute per milligram of protein. Arrows indicate the time of addition of the tested compounds. Asterisks indicate significant differences for trehalase activities after the addition of CT (1.5 and 3.0 μg/ml), subunit (A and B), 100 mM glucose, or 2 mM DNP in comparison with basal trehalase activities (P < 0.05). a’s indicate significant differences for trehalase activities after the addition of CT subunit A in comparison with values after the addition of CT (1.5 μg/ml) and for the same incubation time (P < 0.05).

