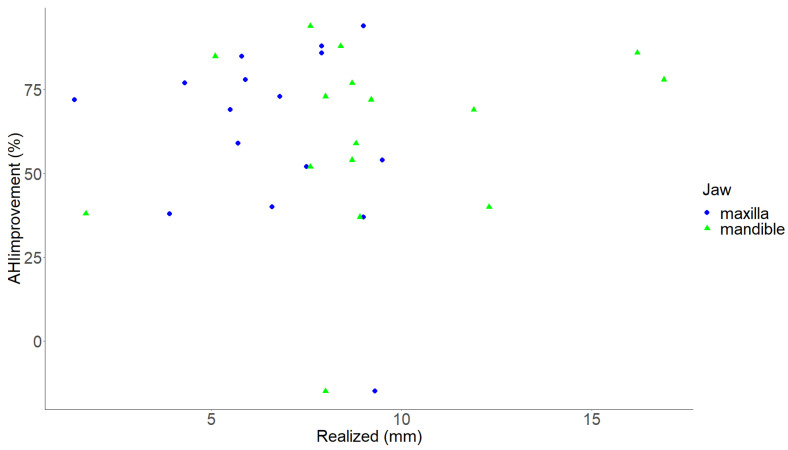
Figure 5.
Scatter plot illustrating the relationship between the realized maxillary and mandibular advancement and the percentage of AHI improvement. The X-axis illustrates the realized advancement in mm. The Y-axis illustrates the AHI improvement in %. Each green triangle depicts an individual maxilla, and each blue dot depicts an individual mandible. AHI, apnea hypopnea index; mm, millimeters; %, percentage. p-value < 0.05 was considered statistically significant.

