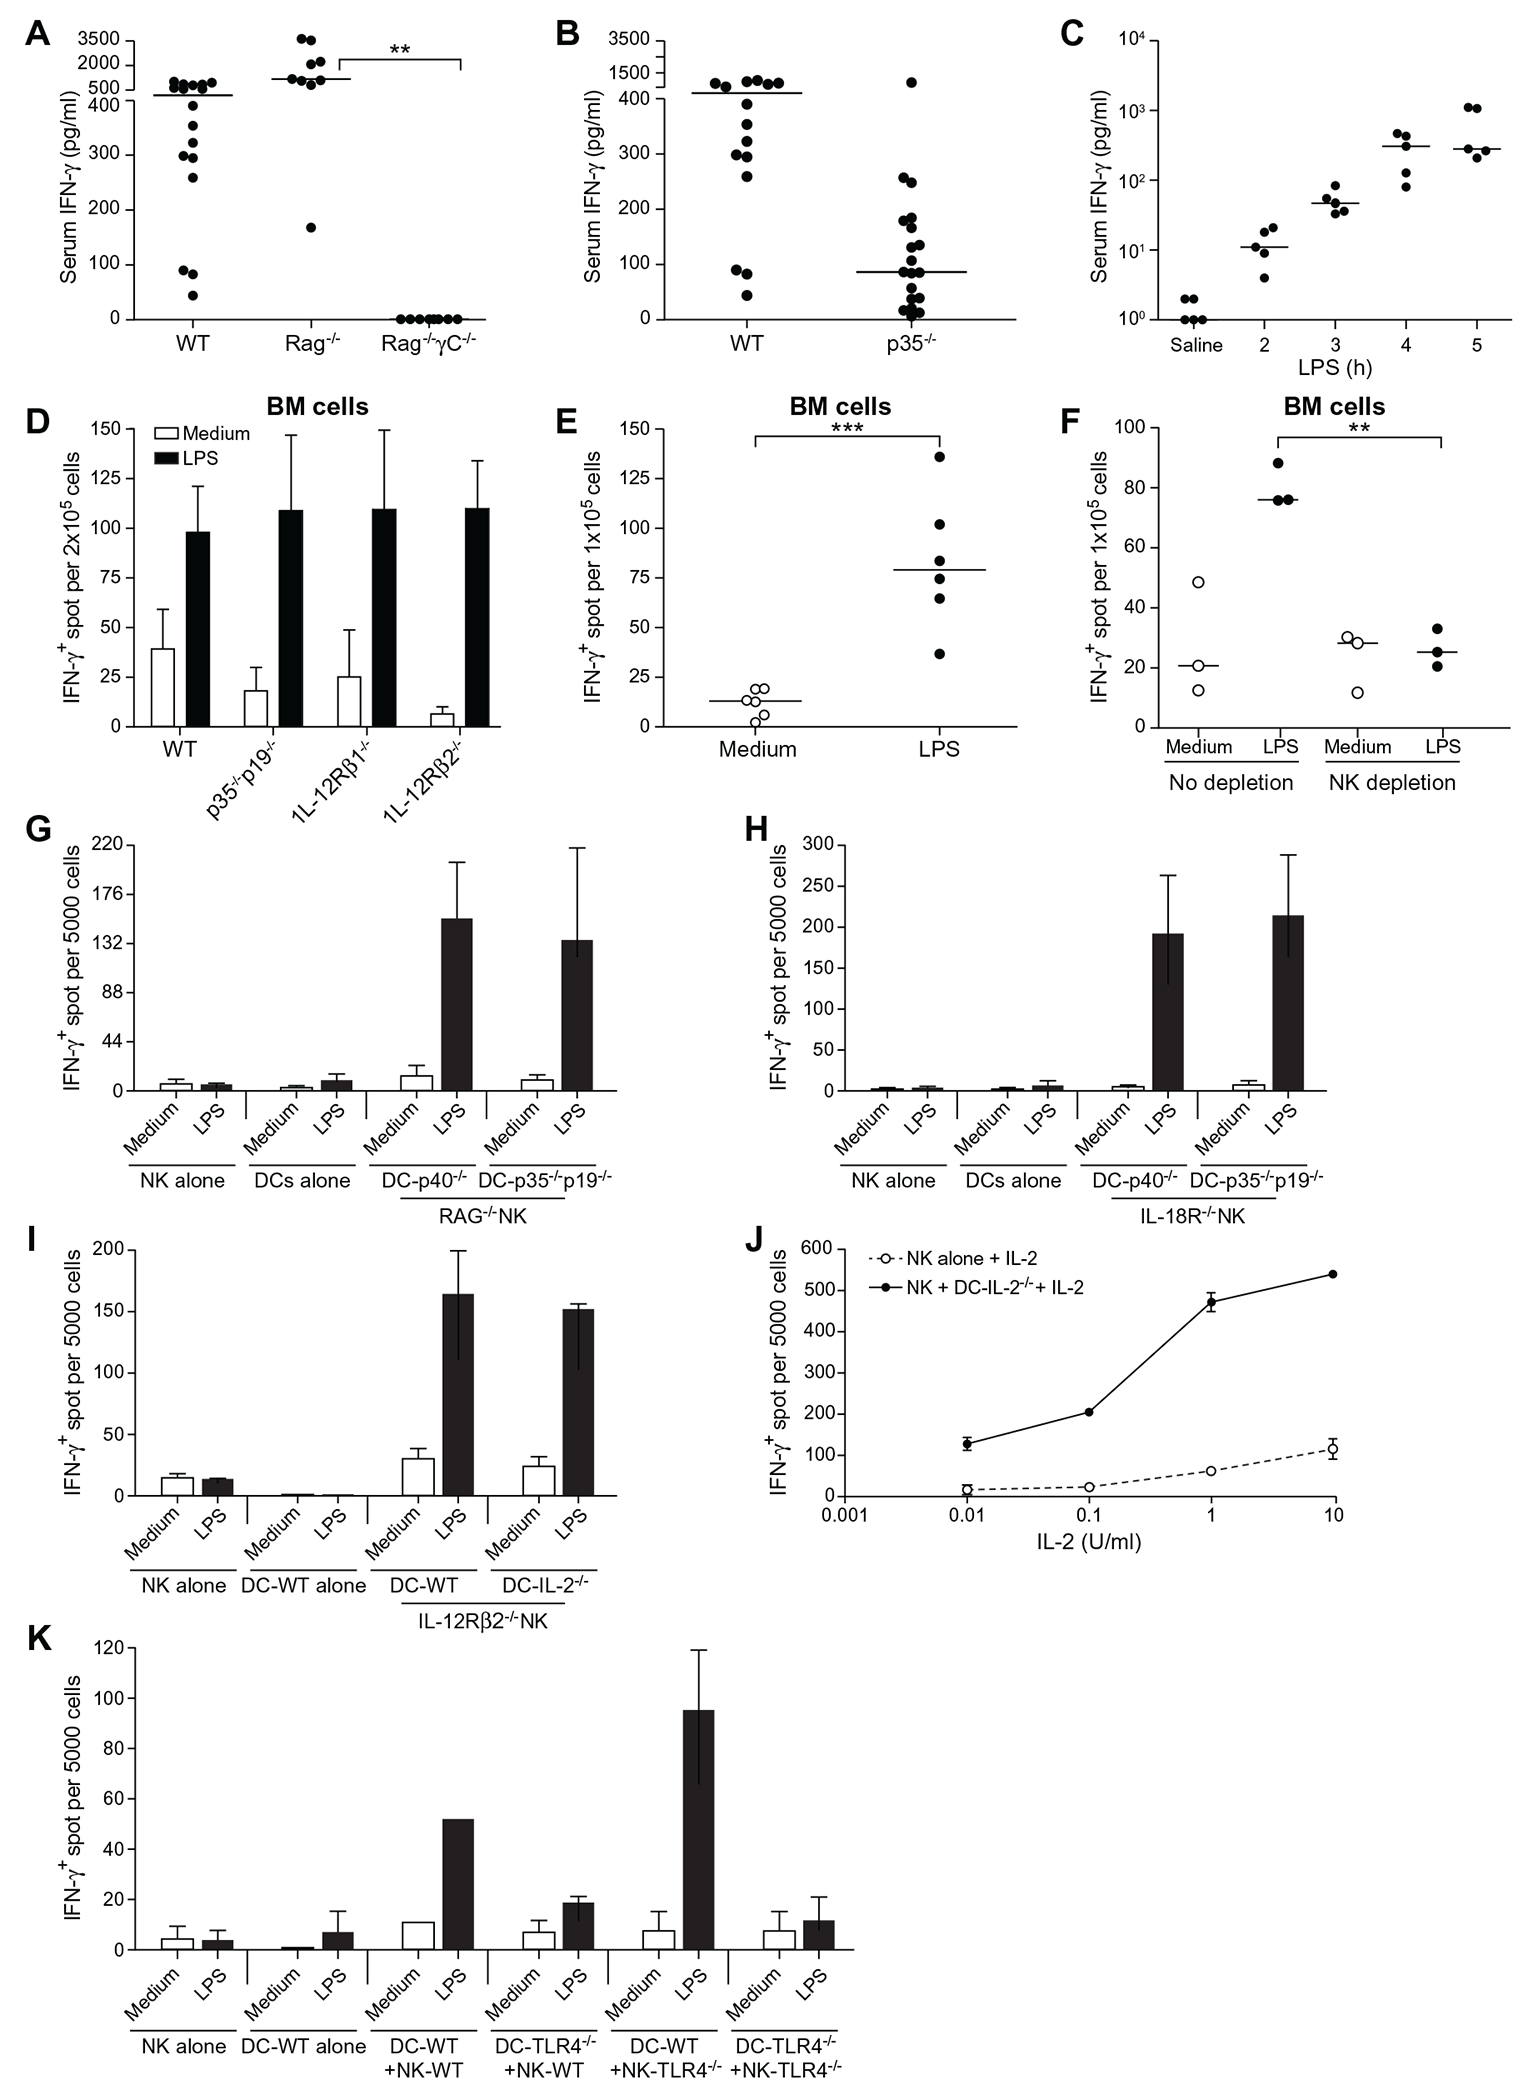
Figure 2. DCs help NK cells make IFN-γ in a TLR4-dependent but IL-2-, IL-12-, IL-23-, and IL-18-independent manner.

(A) Serum IFN-γ measured 6 h post-i.v. injection with 10 μg LPS in WT, RAG−/−, and RAG−/−γC−/− mice. (B) Same as (A), except that WT and IL-12p35−/− mice were compared. (C) Same as (A) except that p35−/−p19−/− double knockout mice were used and that serum IFN-γ was measured at various time points after LPS injection. Each dot represents a different mouse. Statistical significance was assessed by one-way ANOVA. The bars indicate the median. (D) Fresh BM cells from the indicated mice were cultured in ELISPOT plates at 2 × 10⁵ cells/well to detect IFN-γ–secreting cells in the presence or absenceof 200 ng/ml LPS for 18 h at 37°C. Data represent the mean ± SD of three independent experiments. (E) Same as (D) except that the BM cells were from p35−/−p19−/− mice. Each dot represents an independent experiment. Statistical significance was assessed by Student’s t test. (F) Same as (E) except that BM cells were either NK-depleted using anti-NK1.1 plus -NKp46 antibodies or left untouched and cultured at 1 × 10⁵ cells/well. Each dot represents an independent experiment. Statistical significance was assessed by one-way ANOVA. (G) 5 × 10³ NK cells from RAG−/− mice, which had been preenriched by negative sorting for NK cells and directly sorted into the IFN-γ ELISPOT plate using anti-NK1.1 Ab and cocultured with 1 × 10⁴ from p40−/− or -p35−/−p19−/− mice in the presence or absence of LPS for 18 h at 37°C. Data represent the mean ± SD of four independent experiments. (H) Same as (G) except that NK cells were from IL-18R1−/− mice. Data represent the mean ± SD of four independent experiments. (I) Same as (G) except that NK cells were from IL-12Rβ2−/− and that DCs were generated from IL-2−/− mice. Data represent the mean ± SD of at least two or more experiments. (J) The same as (I) except that NK cells were cocultured with DC-IL-2−/− or cultured alone in the presence of various doses of IL-2 plus LPS. Data represent the mean ± SD of at least two or more experiments. (K) Same as (I) except that NK cells and DCs were from WT or TLR4−/− mice, as indicated. Data represent the mean ± SD of two independent experiments. **p<0.01, ***p<0.001.
