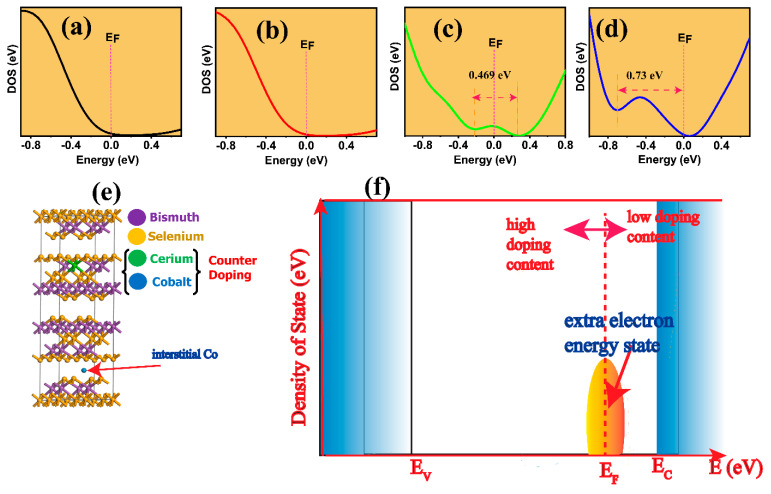
Figure 6.
The enlarged total density of states for (a) BS, (b) BCCS-0.01, (c) BCCS-0.05, (d) BCCS-0.15, (e) the crystal structure of the Ce–Co counter-doped, and (f) the evolution of the extra electron state around the Fermi energy for low and high doing concentrations. (The blue region on the left and right denote the valence and conduction band, respectively; the arrows to the left and right from the Fermi level (EF) represent high and low doping position of extra energy state around the EF).

