Figure 5.
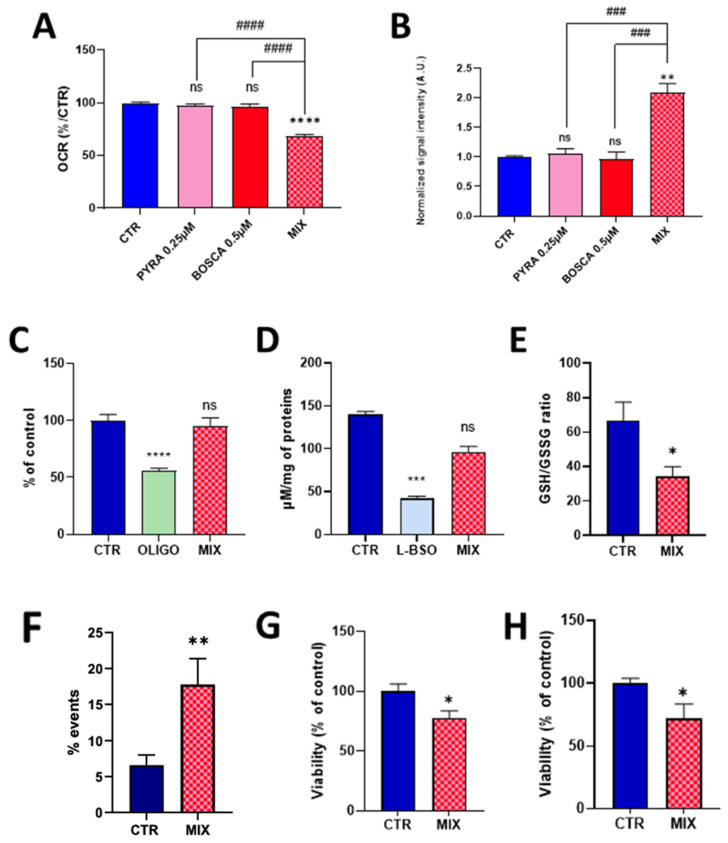
Effect of the exposure of HepG2 cells to a pyraclostrobin 0.25 µM/boscalid 0.5 µM mixture. CTR = control, OLIGO = oligomycin, BSO = buthionine-sulfoximine, BOSCA 0.5 µM = boscalid 0.5 µM, PYRA 0.25 µM = pyraclostrobin 0.25 µM, MIX = pyraclostrobin 0.25 µM/boscalid 0.5 µM mixture. (A) OCR (as % of control), N = 3; (B) level of mitochondrial superoxide radical (compared to control), N= 3; (C) ATP level (compared to control), N = 4; (D) level of total glutathione (reduced GSH and oxidized GSSG forms); (E) ratio between the levels of reduced GSH and oxidized GSSG forms, N = 5; (F) level of early apoptotic cells assessed by flow cytometry, N = 6; (G) cell viability assessed by the crystal violet assay, N = 3; (H) viability assessed by the PrestoBlue mitochondrial function assay, N = 4. Bars represent mean ± SEM. Symbols used for the comparison with the control: (*): p < 0.05, (**): p < 0.01, (***): p < 0.001, (****): p < 0.0001, ns: not significant. Comparison between exposure to individual fungicide and mixture of fungicides: (###): p < 0.001, (####): p < 0.0001.

