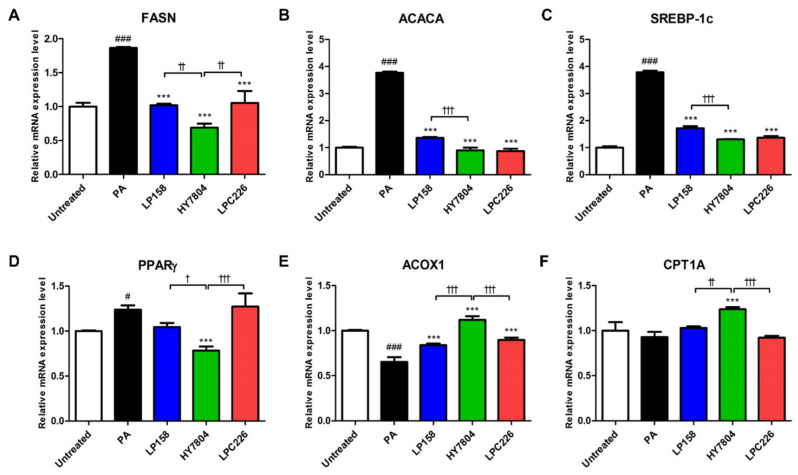
Figure 3.
Effect of probiotics on gene expression by PA-induced HepG2 cells. (A) FASN, (B) ACACA, (C) SREBP-1c, (D) PPARγ, (E) ACOX1, and (F) CPT1A. Results are presented as the mean ± SD. Significant differences are indicated as # p < 0.05, and ### p < 0.001 compared with the Untreated group; *** p < 0.001 compared with the PA group; and † p < 0.05, †† p < 0.01, and ††† p < 0.001 between probiotic groups. PA, palmitic acid treatment group; LP158, Lactiplantibacillus plantarum LP158; HY7804, Lactobacillus helveticus HY7804; LPC226, Lacticaseibacillus paracasei LPC226.

