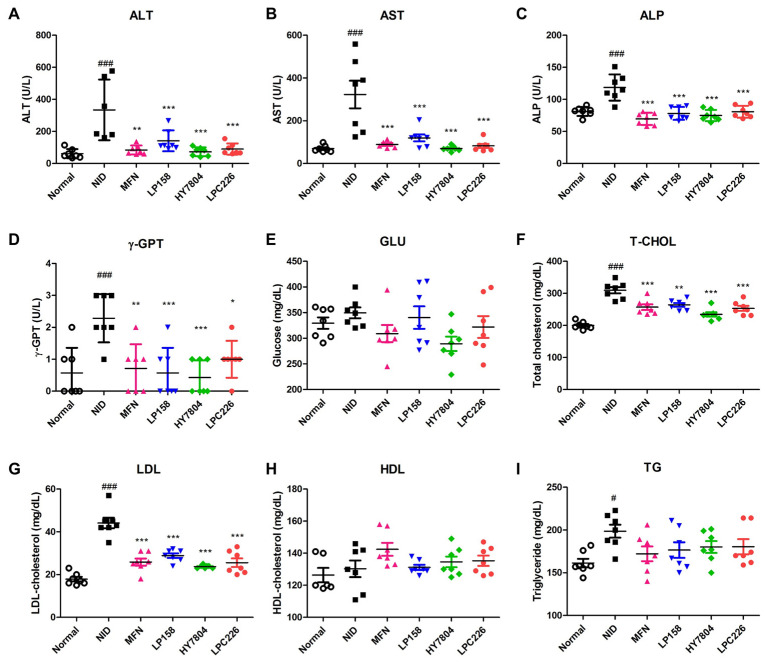
Figure 5.
Effect of probiotics on serum biochemistry in NAFLD-diet-induced mice. (A) ALT, (B) AST, (C) ALP, (D) γ-GPT, (E) GLU, (F) T-CHO, (G) LDL, (H) HDL, and (I) TG levels are shown. Results are presented as the mean ± SD. Significant differences are indicated as # p < 0.05 and ### p < 0.001 compared with the normal group, and * p < 0.05, ** p < 0.01, and *** p < 0.001 compared with the NAFLD diet group. NID, NAFLD-induced diet; MFN, metformin; LP158, Lactiplantibacillus plantarum LP158; HY7804, Lactobacillus helveticus HY7804; LPC226, Lacticaseibacillus paracasei LPC226; ALT, alanine transferase; AST, aspartate transferase; ALP, alkaline phosphatase; γ-GTP, gamma glutamyl transferase; GLU, glucose; T-CHO, total-cholesterol; LDL, low-density lipoprotein cholesterol; HDL, high-density lipoprotein cholesterol; TG, triglyceride.

