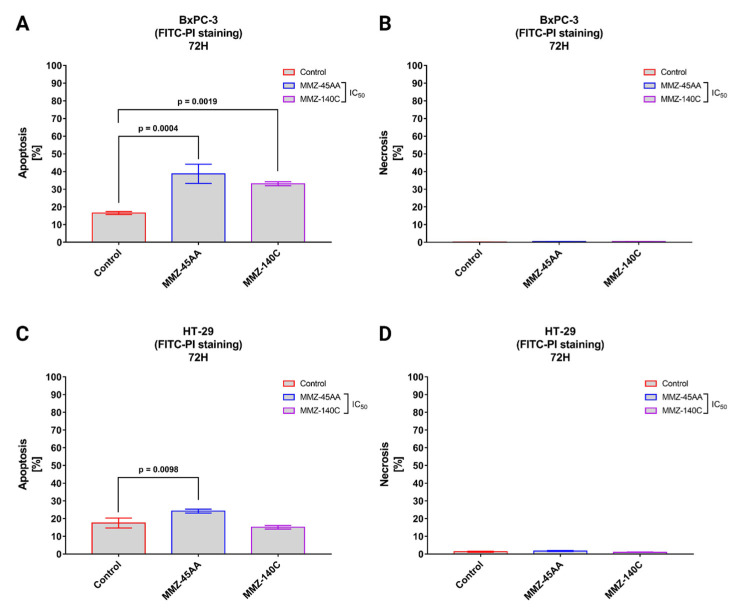
Figure 7.
Apoptosis and necrosis induction in BxPC-3 cells (A,B) and HT-29 cells (C,D) treated with IC50 concentrations of MMZ-45AA and MMZ-140C compounds measured with Annexin V FITC following 72 h incubation time. Data are presented as mean percentage of apoptotic cells (early and late apoptotic) or necrotic cells ± SD values. The differences between the experimental samples and (untreated) control were evaluated by the ANOVA test followed by Tukey’s test (p < 0.05); N = 200.

