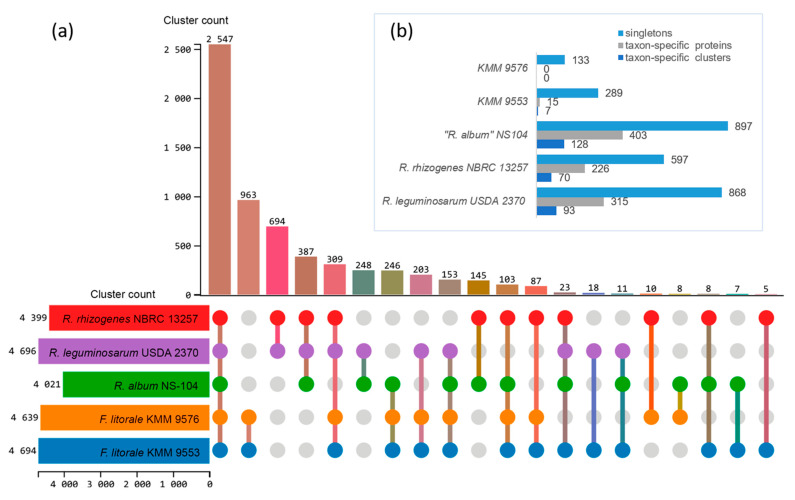
Figure 4.
Proteome comparison of Fererhizobium strains and type strains of closely related genera “R. album” NS-104T, R. leguminosarum NBRC 14778T, and R. rhizogenes NBRC 13257T using OrthoVenn3. UpSet–JS table displays common (a) and unique (b) orthologous clusters, and singletons (b). Horizontal bar chart on the left shows the number of orthologous clusters per strain. Right vertical bar chart indicates the number of orthologous clusters shared among the strains. The lines represent intersecting sets. Upper horizontal bar chart (b) shows the number of taxon-specific clusters including their proteins and singletons per strain.

