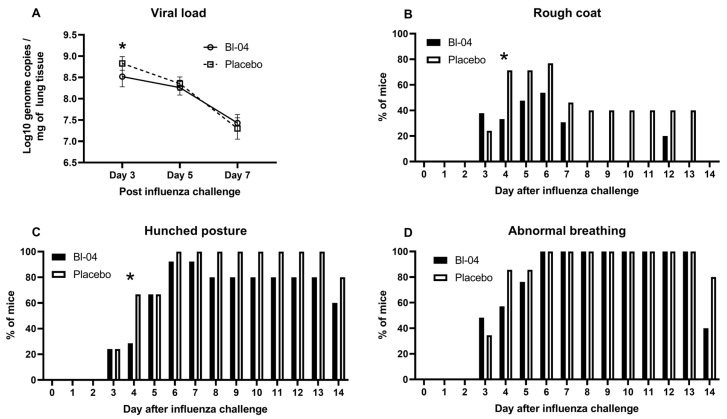
Figure 1.
Viral load and health scores in IAV-infected mice. (A) Mean +/− SD IAV H1N1 log10 genome copies per mg of mouse lung tissue measured by RT-qPCR at days 3, 5, and 7 post-infection in Bl-04 (n = 8) and placebo (n = 8) groups. * Estimated difference for linear mixed-effects model for log10-viral load significant at day 3 (p = 0.0004). (B) Percentage of mice with rough coat at different study days in Bl-04 and placebo groups. * Odds ratio for the treatment difference between groups significant at day 4 (p = 0.046). (C) Percentage of mice with hunched posture at different study days in Bl-04 and placebo groups. * Odds ratio for the treatment difference between groups significant at day 4 (p = 0.039). (D) Percentage of mice with abnormal breathing at different study days. For health scores, the number of animals per group was 29 for days 0–3, 21 for days 4–5, 13 for days 6–8, and 5 for days 9–14.

