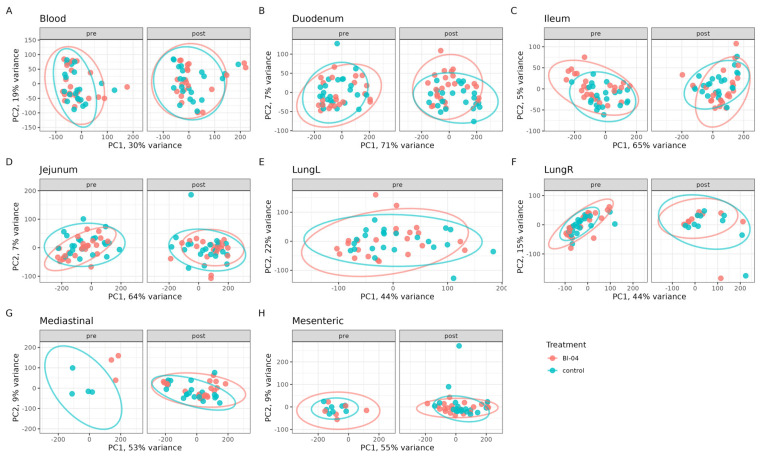
Figure 2.
Global transcriptomics analyses of Bl-04 and placebo groups in all tissues tested over the course of the study. The data points of the same analysis are divided into pre- and post-infection timepoint panels. Principal component analysis (PCA) of transcriptomes of all samples tested in Bl-04 (red) and placebo control (blue) group. Tissues are separated into individual panels (A–H). Each point is an individual sample transcriptome containing all genes expressed. Ellipses represent a 95% confidence level for a multivariate t-distribution.

