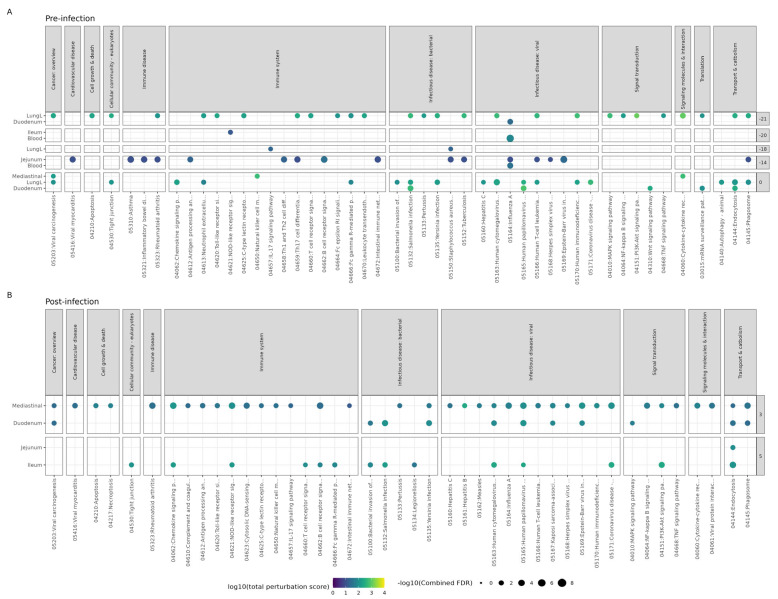
Figure 3.
Pathway analysis results of Bl-04 treatment group compared to the placebo group. ROntoTools pathway analysis using differential expression comparing Bl-04 to placebo group within each timepoint and tissue at (A) pre-infection and (B) post-infection. All points shown are significant (combined FDR < 0.05), with the color denoting the total level of pathway perturbation and the size denoting the significance. Pathways from selected categories are shown. All pathways can be found in Table S2. Any timepoint or tissue not shown is due to no significant pathway perturbation.

