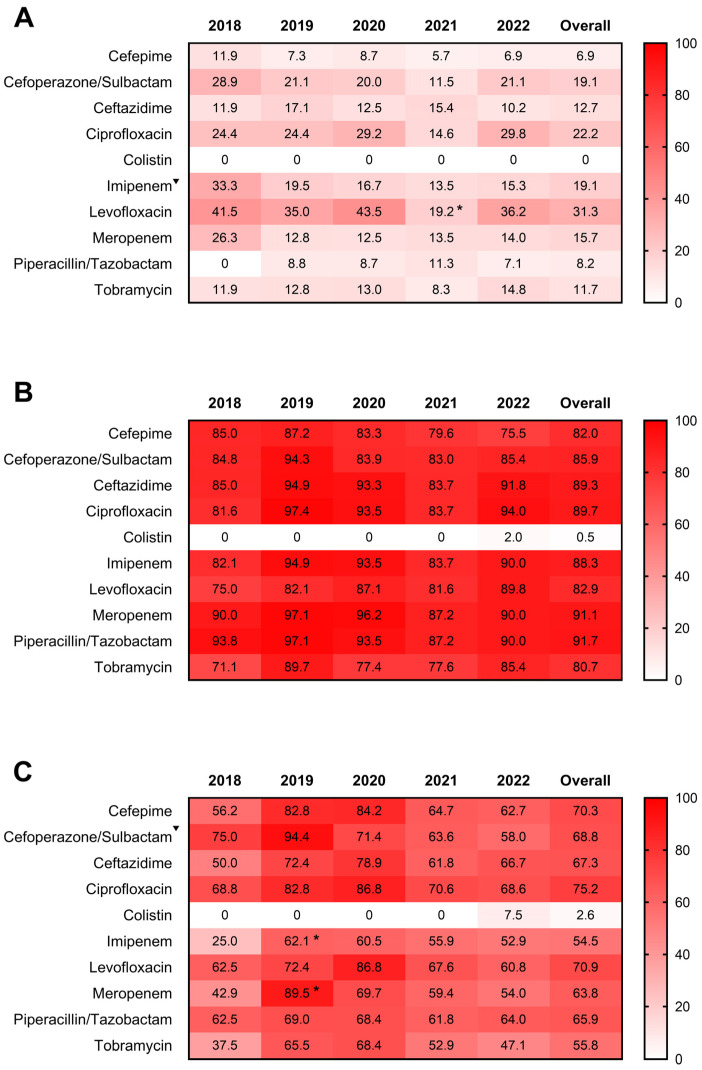
Figure 4.
Antimicrobial resistance profiles of P. aeruginosa (A), A. baumannii complex (B), and K. pneumoniae (C) isolated from sputum samples of respiratory inpatients from 2018 to 2022. Numbers in the heat maps represented the percentage of antibiotic resistance to the tested drugs. The Total column represented the overall 5-year drug resistance rates. * indicated p < 0.05 when compared to the data in the previous years. ▼ indicated p < 0.05 for the drug-resistant trend from 2018 to 2022.

