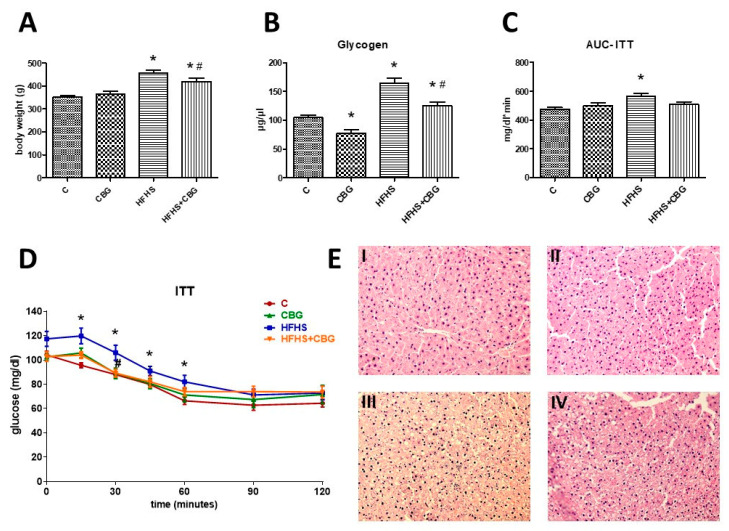
Figure 12.
The body weight of rats at the end of the experiment (A), liver glycogen concentration (B), the area under the curve during the Insulin Tolerance Test—ITT (AUC-ITT) (C), the blood glucose levels during the ITT (D), as well as representative histological images (E) showing hematoxylin–eosin (H + E) staining of the hepatic tissue from the control group (I), CBG group (II), HFHS group (III), and HFHS + CBG group (IV). The blood glucose levels were assessed using a glucose analyzer and test strips, and glycogen concentration was determined using a commercially available kit, as described in the Materials and Methods Section 2. The results are presented as mean ± SD and the data are from n = 6 rats (ITT and AUC-ITT) or n = 10 rats (body weight and glycogen level); *—p < 0.05 significant difference vs. control group, #—p < 0.05 significant difference vs. HFHS group.

