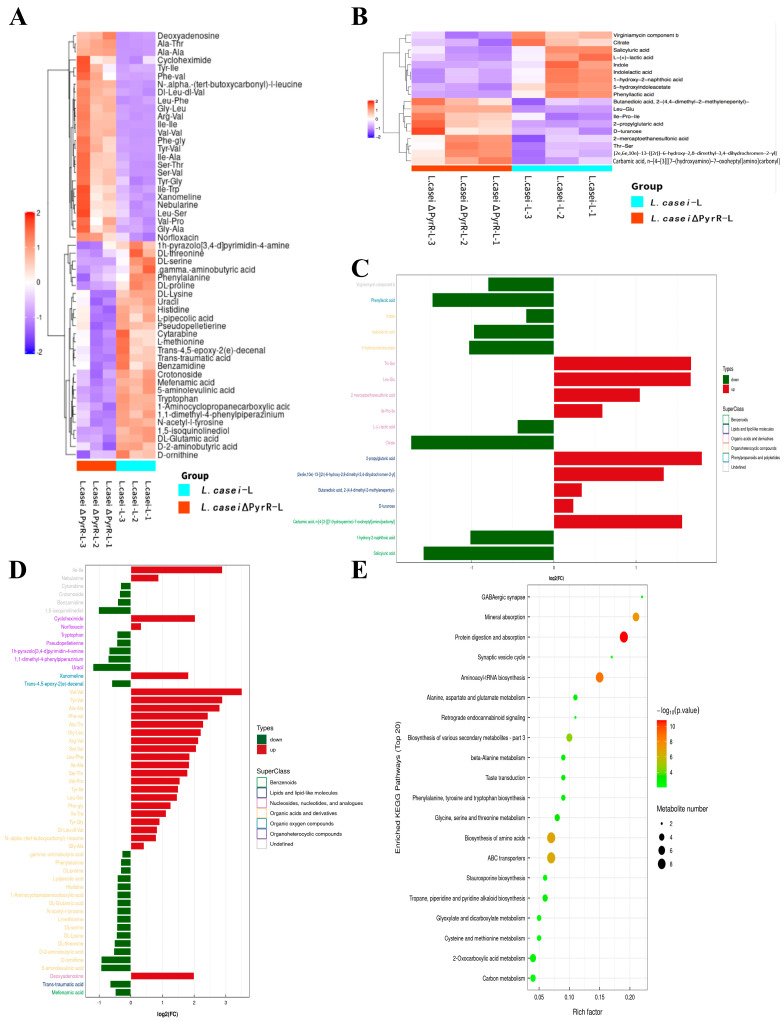
Figure 4.
Global, non-targeted metabolomes of L. casei and L. casei ΔPyrR cell-free supernatants. (A) Heat map of 53 metabolites ranked according to the magnitude of fold differences between the L. casei and L. casei ΔPyrR group within the positive-ion mode. (B) Heat map of 18 metabolites ranked according to the magnitude of fold differences within the negative-ion mode. (C) Major differential metabolites were classified into pathways associated with biological processes from the negative-ion mode. (D) Major differential metabolites were classified into pathways associated with biological processes from the positive-ion mode. (E) Bubble map of metabolic pathway enrichment analysis. The X-axis enrichment factor (RichFactor) is the value of the differential metabolites annotated in the pathway. Larger values indicate a greater proportion of differential metabolites annotated in the pathway. The dot size represents the number of differential metabolites annotated in the pathway.

