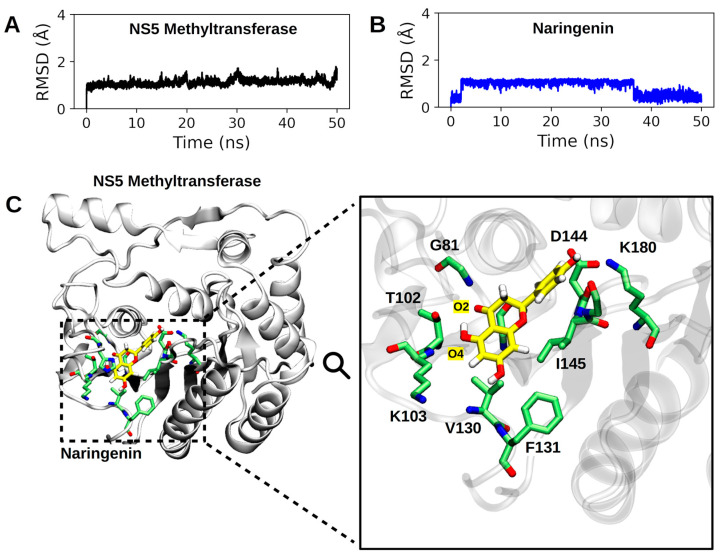
Figure 7.
Summary of MD simulation results. In (A,B), the RMSD profiles of the NS5-methyltransferase:naringenin complex are presented. In (A), the RMSD profile of the NS5 subunit (backbone atoms) is shown, and in (B), the RMSD profile of the heavy atoms of naringenin. (C). Binding pose of naringenin at the binding site of NS5-methyltransferase. The entire complex is shown on the left, and the active site residues make close contact (<4.5 Å) with naringenin. The hydrogen atoms of the protein residues have been omitted to improve visualization. The carbon atoms of naringenin are shown in yellow.

