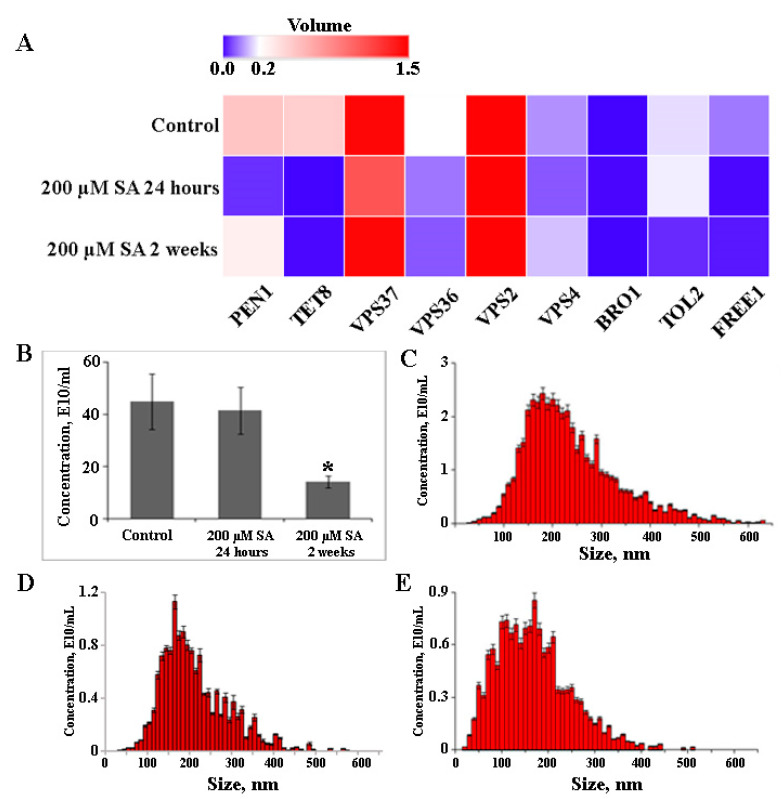
Figure 4.
Expression levels of genes involved in EV biogenesis (A) and EV concentrations (B) in A. thaliana callus under control and salicylic acid (SA) treatments. Nanoparticle tracking analysis of EVs isolated from A. thaliana control calli (C) compared to those from SA-treated calli after 24 h (D) and 2 weeks (E). Data shown are mean ± SE, n = 3. Asterisks denote significant differences at p < 0.05 (*), Student’s t-test.

