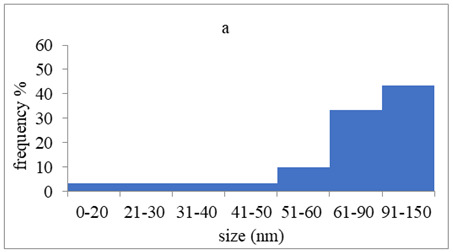
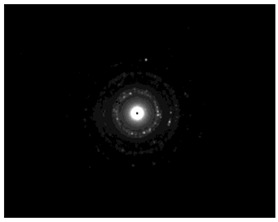
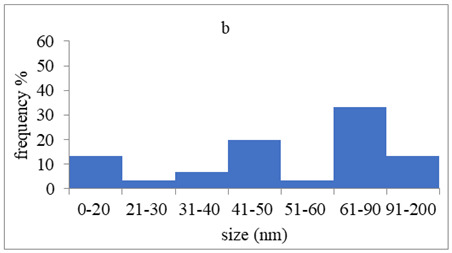
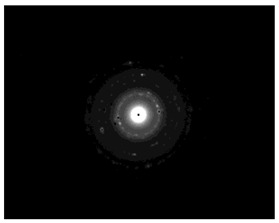
Table 4.
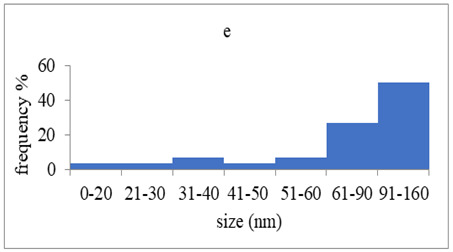
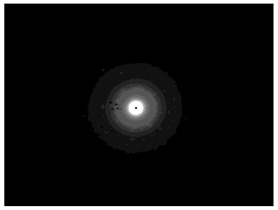
Particle size distribution, SAED patterns and Miller indices of the silver nanoparticles.
| Sample | Particle Size Distribution | SAED Patterns | Miller Index | |||
|---|---|---|---|---|---|---|
| Ag (111) | Ag (220) | Ag (200) | Ag (311) | |||
| d-Spacing (nm) | ||||||
| AgNP |
|
|
0.2403 | 0.2098 | 0.1458 | 0.1233 |
| MT6-AgNP |
|
|
0.2386 | - | 0.1412 | 0.1241 |
| AgNP-MT6 |
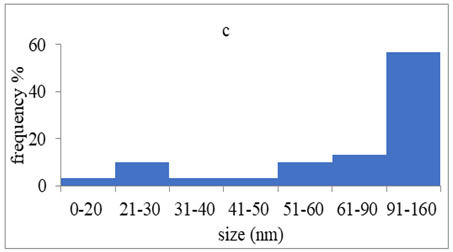
|
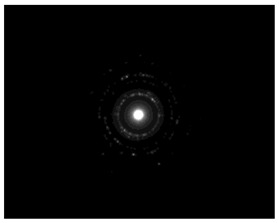
|
0.2391 | 0.2088 | 0.1458 | 0.1244 |
| CuTP1-AgNP |
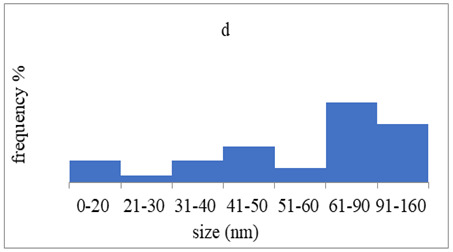
|
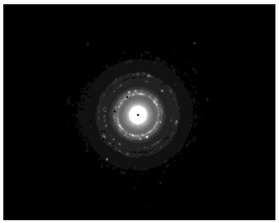
|
0.2412 | 0.2088 | 0.1463 | 0.1241 |
| AgNP-CuTP1 |
|
|
0.2413 | 0.2038 | 0.1449 | 0.1244 |
