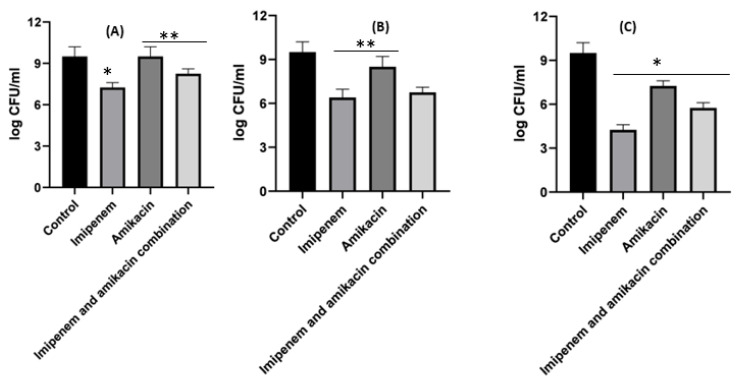
Figure 6.
Different MIC (µg/mL) at 24 h for imipenem, amikacin and a combination of imipenem and amikacin at 0.25 MIC (µg/mL) (A), 0.5 MIC (µg/mL) (B) and 1 MIC (µg/mL) (C) using Acinetobacter baumannii. Data were extracted from Figure 5A–C for comparison purposes. * Denotes a statistically significant difference p < 0.05; ** denotes statistically non-significant difference p > 0.05.

