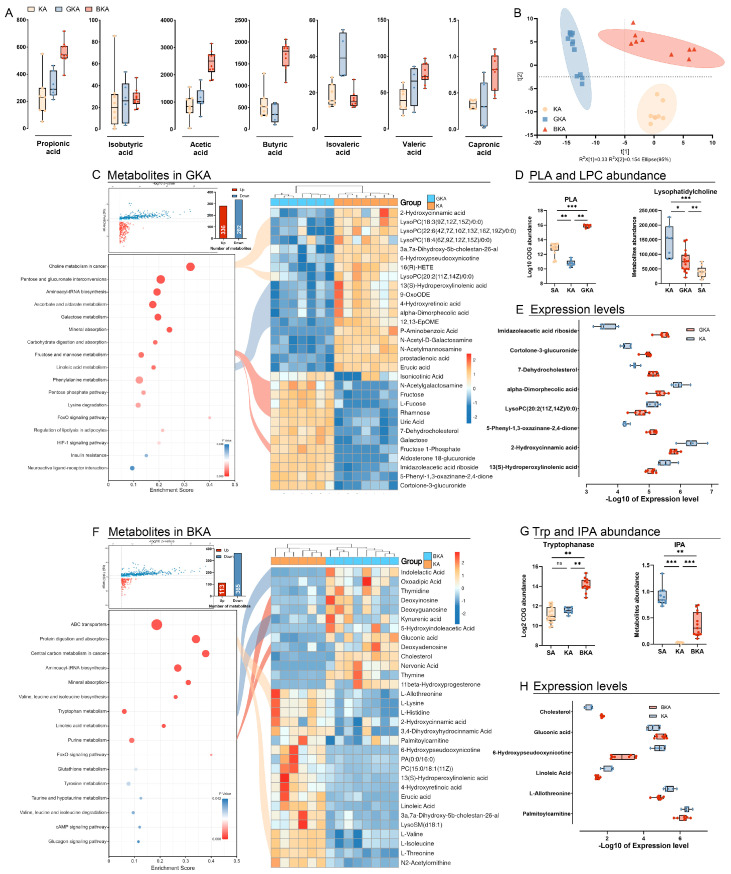
Figure 6.
Germ−depletion and butyric acid treatment remodeling the gut metabolism. (A) SCFAs measurement. (B) PLS-DA among KA, GKA, and BKA groups. (C) Metabolites altered significantly between the KA and GKA groups. (D) LPC concentration and PLA abundance. (E) Expression level of metabolites between the KA and GKA groups. (F) Metabolites altered significantly between the KA and BKA groups. (G) Abundance of tryptophanase and concentration of IPA. (H) Expression level of metabolites between the KA and BKA groups. All data were shown with mean ± SD, * p < 0.05, ** p < 0.01, *** p < 0.001.

