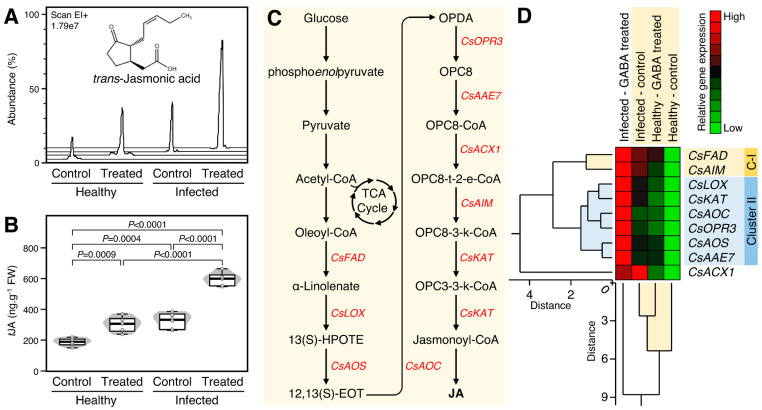
Figure 5.
Effect of γ-aminobutyric acid (GABA) supplementation on the endogenous trans-jasmonic acid (tJA) levels and its biosynthesis genes in the leaves of healthy and ‘Ca. L. asiaticus’-infected Valencia sweet orange (C. sinensis). (A) Representative chromatograms of tJA from healthy and Ca. L. asiaticus’-infected (infected) leaves without GABA treatment (Control) or after the treatment with 10 mM GABA (treated). (B) Endogenous tJA contents (ng g−1 FW) from healthy and Ca. L. asiaticus’-infected (infected) leaves without GABA treatment (Control) or after the treatment with 10 mM GABA (treated). The minimum and the maximum values are presented by whiskers, while thick horizontal lines specify the median. Boxes show the interquartile ranges (25th to 75th percentile of the data), white dots represent the raw data (n = 6), and the gray shading represents the corresponding violin plot. Presented p-values are based on a two-tailed t-test to statistically compare each pair of treatments. Statistical significance was established as p < 0.05. (C) Schematic representation of the tJA biosynthesis pathway. (D) Relative gene expression of tJA biosynthesis genes in healthy and Ca. L. asiaticus’-infected (infected) leaves without GABA treatment (Control) or after the treatment with 10 mM GABA (GABA treated). The transcript levels were organized using two-way hierarchical cluster analysis (HCA) using standardized gene expression patterns using Ward’s minimum variance method and presented as a heat map. Rows represent different genes, while columns represent different treatments. Low and high expression levels are indicated with green and red colors, respectively (see the scale at the top right corner). The full list of expressed genes, names, accession numbers, and primers is available in Supplemental Table S4.

