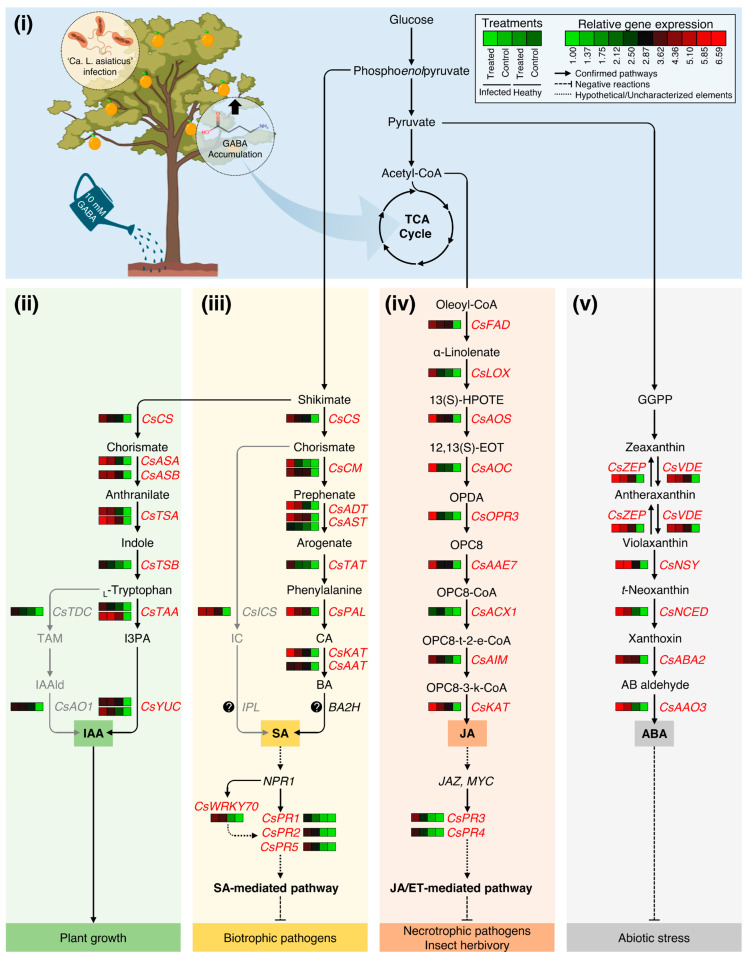
Figure 8.
Hypothetical model for the potential effects of GABA supplementation on different phytohormonal pathways in Valencia sweet orange (C. sinensis) and their roles in citrus defense responses. In this model, we proposed that exogenous GABA application via root drench might enhance citrus response to the infection with the bacterial pathogen ‘Ca. L. asiaticus’ via modulation of different phytohormone groups, particularly stress-associated phytohormones. Briefly, (i) exogenous GABA application boosts the accumulation of endogenous GABA in the leaves of both healthy and ‘Ca. L. asiaticus’-infected plants. GABA accumulation in the leaves benefits the activation of a phytohormones-based multi-layered defensive system via promoting the endogenous content of auxins, SA, JA, ABA, and their biosynthetic genes. (ii) GABA accumulation stimulates the auxin biosynthesis in GABA-treated ‘Ca. L. asiaticus’-infected plants via the activation of the indole-3-pyruvate (I3PA) pathway, not via the tryptamine (TAM)-dependent pathway. Higher auxin levels are involved in enhancing the growth of HLB-affected tress via several biochemical and physiological modifications, yet to be identified. (iii) GABA accumulation is also associated with the upregulation of SA biosynthesis genes, particularly the PAL-dependent route, resulting in higher SA levels that activate NPR1 and subsequently CsPR1, CsPR2, CsPR5, and CsWRKY70 prominent to activation of SA-mediated pathway against biotrophic phytopathogens. (iv) GABA supplementation induces JA biosynthesis. Enhanced JA levels are linked with both CsPR3 and CsPR4 which activate the JA-mediated pathway against insect herbivory and necrotrophic phytopathogens. Finally, (v) GABA application enhances the ABA biosynthesis pathway to protect citrus plants against abiotic stress. Solid lines with arrows indicate the well-established/confirmed pathways and the dashed lines with whiskers signify negative reactions, whereas round-dotted lines represent hypothetical mechanisms or uncharacterized elements. Relative gene expressions of phytohormones biosynthesis-related genes and pathogenesis-related proteins (PRs) are presented as a heatmap using the non-standardized gene expression patterns using Ward’s minimum variance method. Low and high expression levels are indicated with green and red colors, respectively (see the scale at the top right corner). The full list of expressed genes, names, accession numbers, and primers is available in Supplemental Materials (Tables S1–S5).

