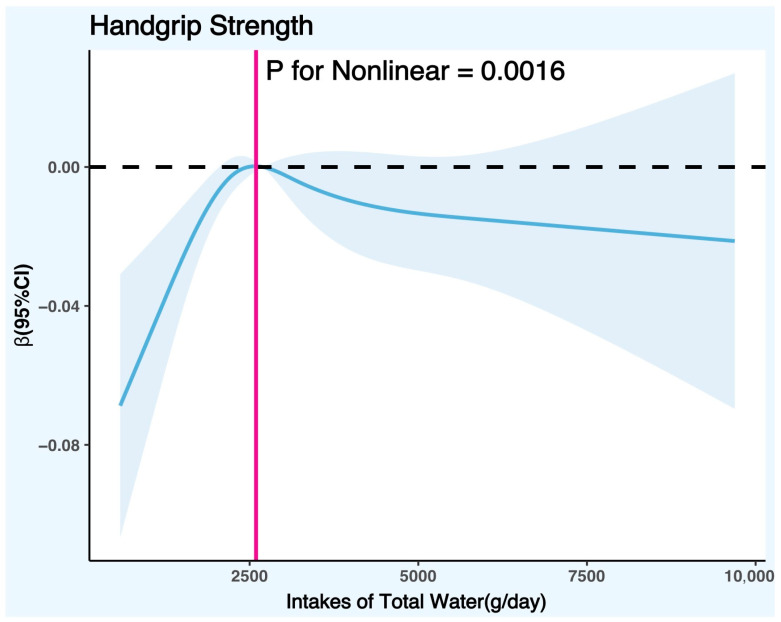
Figure 3.
Restricted cubic spline plot model (males). Legend: the adjusted restricted cubic spline plot model shows all participants’ association between DTIW and HGS. The model was adjusted for age, race, BMI, education level, PIR, smoking status, alcohol consumption, physical activity level, daily total intake of protein, daily total intake of energy, daily total intake of carbohydrates, daily total intake of sugars, daily total intake of fat, diabetes, hypertension, hyperlipidemia, and cancer. The blue solid line and the blue shaded area represent the estimated regression coefficient Beta and its 95% confidence interval.

