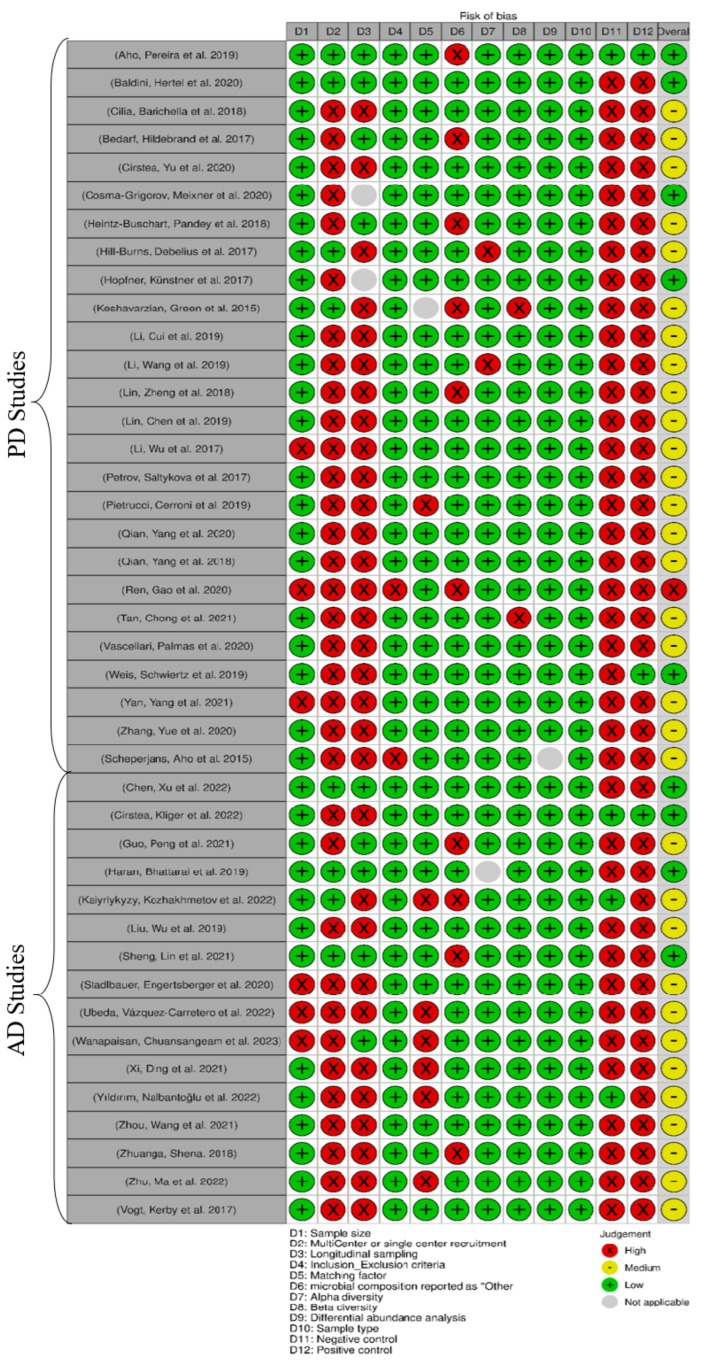
Figure 2.
Risk of bias assessment with corresponding biases (D1 to D12) and risk indicators: green: low risk; yellow: medium risk; red: high risk; and gray: not applicable [14,17,18,19,20,21,22,23,24,25,26,27,28,38,39,40,41,42,43,44,45,46,47,48,49,50,51,52,53,54,55,56,57,58,59,60,61,62,63,64,65,66].

