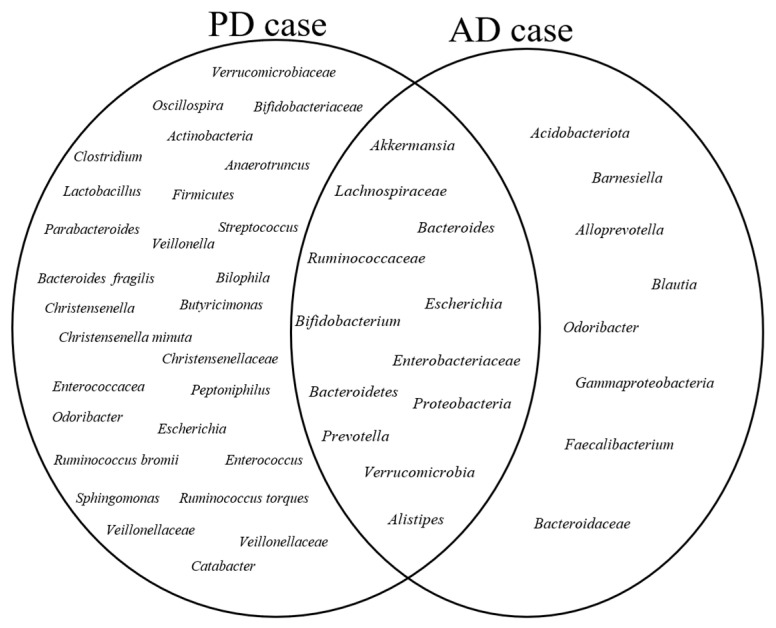
Figure 4.
Highly abundant bacterial communities in PD and AD Cases: A Venn diagram representing bacterial communities reported as highly abundant in PD and AD cases across multiple included studies. The circles represent the bacterial taxa found in each disease group, while the overlapping sections denote the shared bacteria between PD and AD cases. These highly abundant microbial communities were consistently reported as such when compared to their respective healthy control groups in the included studies.

