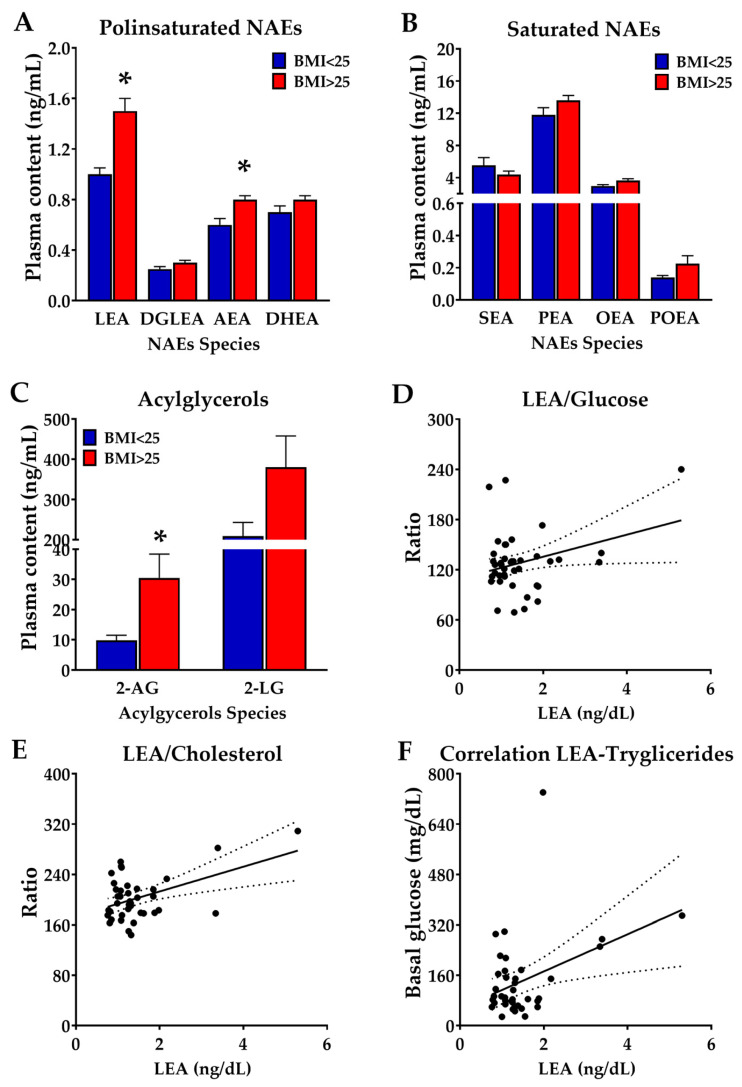
Figure 1.
(A,B); Plasma concentrations of NAEs in a representative Mediterranean population of Spain (city of Pizarra) stratified on the basis of their body mass index in lean (BMI < 25, N = 13) versus obese (BMI > 25, N = 34) subjects. (C) Plasma concentration of the acylglycerols 2-Arachidonoyl glycerol (2-AG) and 2-LG in the same population. Correlation of plasma LEA concentrations with that of (D) glucose, (E) cholesterol, and (F) triglycerides. Dashed lines correspond to confidence intervas * p < 0.05 versus BMI < 25 patients (ANOVA).

