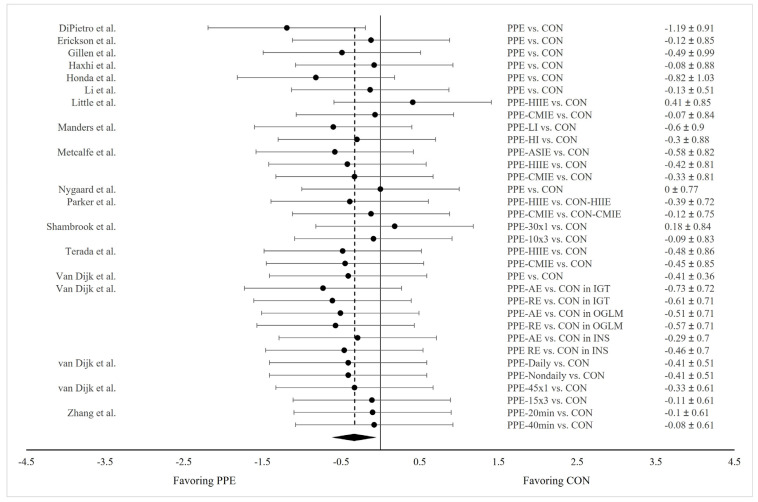
Figure 3.
Forest plot showing comparisons of 24 h mean glucose concentrations between PPE and CON. The X-axis denotes effect size derived from the random-effect meta-analysis. The data in the center-right column specify the conditions under which PPE and CON were compared, while the far-right column provides the effect size and 95% confidence interval (CI) for each comparison. The diamond at the bottom represents the pooled effect size (Hedge’s g = −0.328; SE = 0.062; 95% CI = −0.453, −0.203; p < 0.001) based on all the studies combined.

