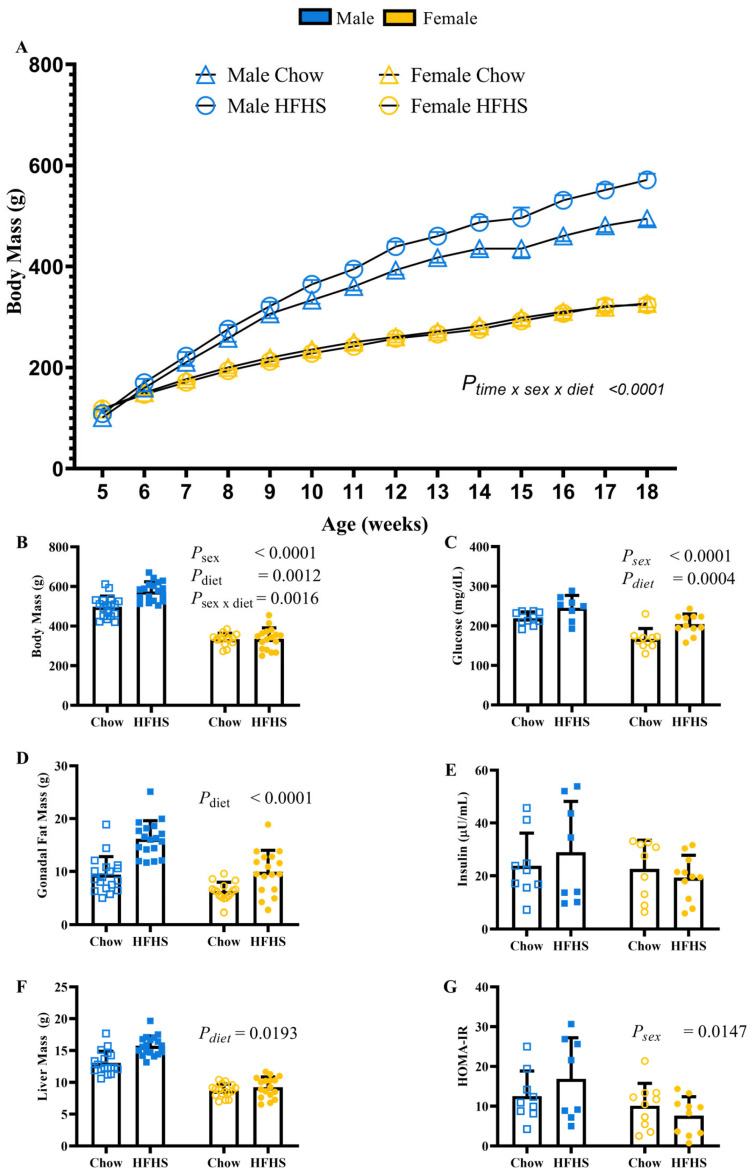
Figure 1.
Animal Characteristics. (A), Body Mass from the beginning of dietary intervention through 14 weeks (mean ± SD). Blue open squares = Males on chow diet, blue closed squares = Males on HFHS diet, yellow open circles = Females on chow diet, yellow closed circles = females on HFHS diet. (B), Body mass 14 weeks post dietary intervention (n = 18, 18, 16, 17, respectively, for M Chow, M HFHS, F Chow, and F HFHS) (C), Blood Glucose 14 weeks post dietary intervention (n = 10, 8, 10, 12, respectively) (D), Gonadal Fat mass 14 weeks post dietary intervention (n = 18, 18, 16, 17, respectively) (E), Blood insulin 14 weeks post dietary intervention (n = 9, 8, 9, 11, respectively) (F), Liver mass 14 weeks post dietary intervention (n = 18, 18, 16, 17, respectively) (G), Homeostatic Model Assessment for Insulin Resistance (HOMA-IR) 14 weeks post dietary intervention (n = 9, 8, 10, 10, respectively). In panels A and C-G, blue boxes represent males and yellow circles represent females. Open shapes represent chow fed animals and closed shapes represent HFHS fed animals. Chow = standard diet, HFHS = high-fat high-sugar diet.

