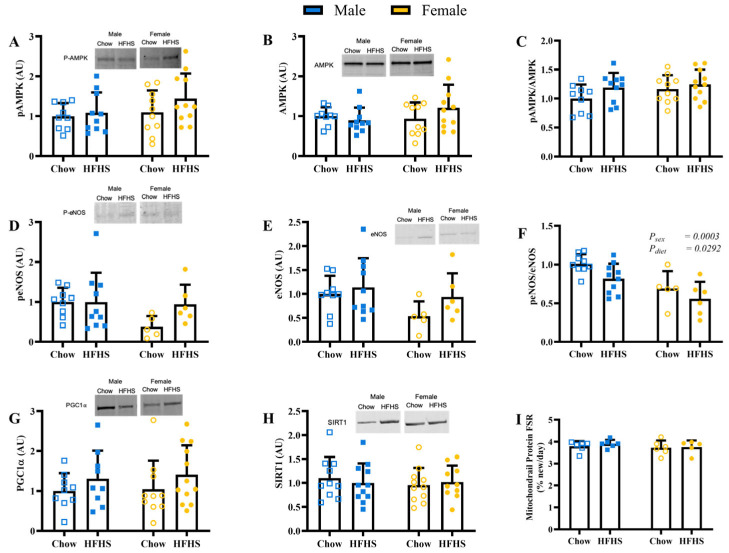
Figure 3.
Skeletal Muscle Mitochondrial Biogenesis. (A), protein content of phosphorylated AMP-activated protein kinase (pAMPK) (n = 9, 10, 10, 12, respectively, for M Chow, M HFHS, F Chow, and F HFHS). (B), protein content of AMP-activated protein kinase (AMPK) (n = 9, 10, 10, 12, respectively). (C), ratio of pAMPK to AMPK (n = 9, 10, 10, 12, respectively). (D), protein content of phosphorylated endothelial nitric oxide synthase (peNOS) (n = 9, 10, 5, 6, respectively). (E), protein content of endothelial nitric oxide synthase (eNOS) (n = 9, 10, 5, 6, respectively). (F), ratio of peNOS to eNOS (n = 9, 10, 5, 6, respectively). (G), protein content of peroxisome proliferator-activated receptor gamma coactivator-1 alpha (PGC1α) (n = 9, 9, 10, 12, respectively). (H), protein content of sirtuin 1 (SIRT1) (n = 10, 11, 11, 10, respectively). (I), Mitochondrial protein fractional synthesis rate (FSR) determined by deuterium labeling (n = 6, 6, 6, 5, respectively). Blue boxes represent males and yellow circles represent females; Open shapes represent chow fed animals and closed shapes represent HFHS fed animals. Chow = standard diet, HFHS = high-fat high-sugar diet.

