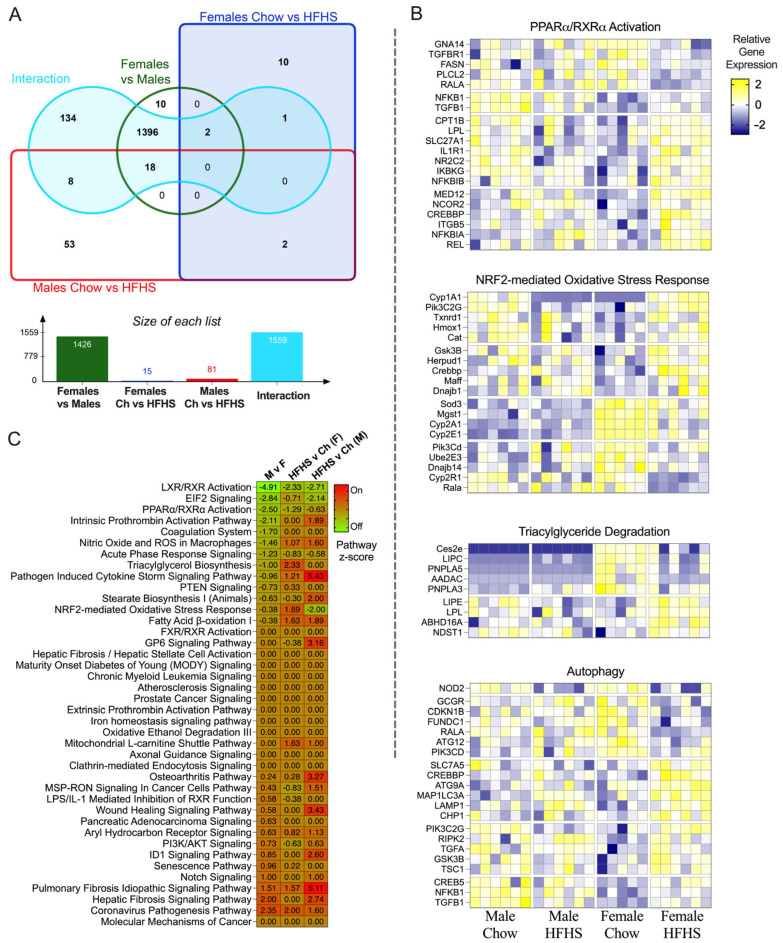
Figure 6.
RNA Sequencing. (A), Venn Diagram and quantification of the number of transcripts shared between group pairs. (B), Significance of pathway enrichment by group. (C), Relative expression of genes within the PI3K/AkT Signaling Pathway, NRF2- Mediated Oxidative Stress Pathway, Triacylglycerol Degradation Pathway, and Autophagy Pathway. Chow = standard diet, HFHS = high-fat high-sugar diet.

