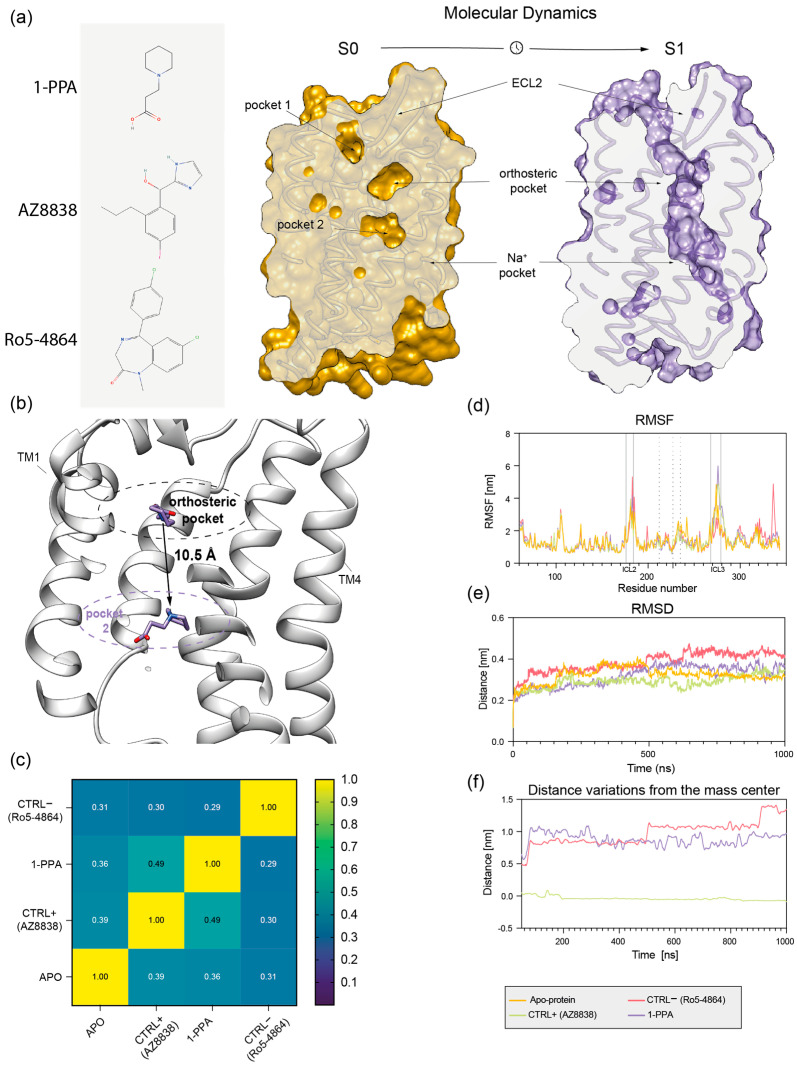
Figure 3.
Molecular dynamics analysis. (a) Chemical structure of the compounds and sliced view of wtPAR2 model shows that three pockets, identified in the initial state (S0) in yellow, unite in a single funnel in the final state (S1), in purple; (b) Sliced view of wtPAR2 model, in white, shows the engulfment of 1-PPA (purple) after the simulations, in the allosteric site the by the allosteric pocket 2; (c) Cross-correlation matrix confronts the stabilizing effects performed by each compound during MDs; (d) RMSF plot representing the residue mobility, dotted lines shows the portion of the ECL2 while continuous lines box the ICL2 and 3; (e) RMSD variation during simulation time; (f) Distance variation of each compound in respect to the initial position shows that AZ8838 remains in the orthosteric pocket, while negative control Ro5-4864 and 1-PPA migrate.

