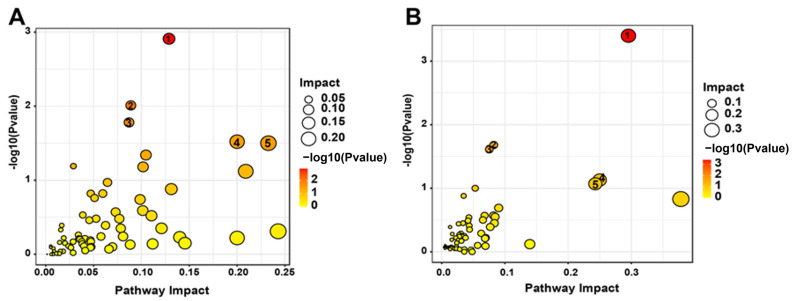
Figure 7.
Bubble diagrams of metabolism pathways of DMs in soybean leaves and roots. (A) L100 vs. LCK; (B) R100 vs. RCK. Each bubble represents a kind of metabolism pathway. The darker and larger the bubble is, the stronger the association between the metabolic pathway and Mn stress is. Larger size and darker color of the bubbles represent a stronger correlation between the metabolism pathway and Mn poisoning.

